

Abstract and Introduction
Abstract
Aims. 'Clearance' is an accepted surrogate for glomerular filtration rate (GFR) that describes the relation between the serum/plasma concentration of a substance, for example, creatinine, and its urinary excretion rate. On a population level the GFR can be estimated from the creatinine concentration by regression analysis. Such estimates inevitably increase the uncertainty compared with the measured quantity, for example, creatinine. Reliable estimates of GFR (eGFR) are crucial for proper administration of drugs with small therapeutic 'windows' and require a transformation of 'normalised' GFR to 'individual' GFR using the individual's anthropometric data. By simulation we compare some common algorithms and discuss their feasibility for drug dosing.
Methods. We compared four algorithms for normalised eGFR and one for individual eGFR in a Caucasian man defined by age and simulated the outcome of different S-Creatinine concentrations. Normalised and individual eGFR were interconverted using published anthropometric data of a national average man.
Results. Differences between results by the algorithms for eGFR were less than the uncertainty within the diagnostically important interval. Three of the four algorithms were non-continuous at extreme S-Creatinine concentrations. Normalised eGFR values, converted to individual eGFR resulted in an underestimation of 5–40% compared with that by Cockcroft-Gault.
Conclusions. The use of algorithms will increase the uncertainty of results. The difference between different algorithms is small. A global staging recommendation is in jeopardy due to the large interindividual biological variation. Dosage of critical drugs, based on conversion of normalised eGFR, may lead to an underdosage compared with the dosage estimated by Cockroft-Gault.
Introduction
A common biomarker for kidney disease is S-Creatinine concentration (In this document the notations S-Creatinine and U-Creatinine are used for the concentration of creatinine in serum/plasma and urine). Glomerular filtration cannot be measured directly and the concept of clearance was introduced as a surrogate quantity, an inverse function of S-Creatinine (formula 3). 51Cr-EDTA, iohexol or iothalamate are nowadays used as exogenous marker substances. The endogenous creatinine clearance was developed by Miller and Winkler in 1938[1] as an alternative to exogenous creatinine clearance.[2] Algorithms to estimate clearance from a single measurement of S-Creatinine were published by Effersoe (1957)[3] and Jelliffe (1973)[4] and a nomogram for bedside use by Siersbaek-Nilsson (1971).[5] The algorithm by Cockcroft and Gault (1976) (C-G)[6] includes gender, age and body weight in addition to S-Creatinine. The development of algorithms accelerated after the publication of 'Clinical practice guidelines' by the 'National Kidney Foundation' in 2002.[7] Commonly used algorithms to find estimates of glomerular filtration rate (eGFR) include S-Creatinine, age, gender and ethnicity. Consequently, such algorithms will give the same eGFR for all patients of the same age and gender at a given S-Creatinine but the outcome may vary between algorithms. Algorithms are established using various regression strategies and population cohorts. Published scatterplots show a considerable individual variation around the regression line.
Recommendations for dosing of critical drugs which are eliminated by filtration by the kidneys are often based on eGFR, commonly the C-G algorithm.
In the present study we compare eGFR estimated by five different algorithms and investigate the possibility to transform normalised eGFR (eGFRNorm) to individual (eGFRInd) by applying anthropometric information.
Methods
eGFR was calculated for S-Creatinine (Isotope Dilution-Mass Spectroscopy (IDMS)-calibrated) between 50 μmol/L and 200 μmol/L applying the MDRD, CKD-EPI, original Lund-Malmö (LMOrig), the revised Lund-Malmö (LMRev)[7–10] and C-G algorithms[6] assuming a Caucasian man, aged 55 years assumed to represent 'middle age'. The first four algorithms report eGFRNorm whereas the individual eGFRInd is estimated by the C-G.
The eGFR (MDRD) was chosen as the comparative reference procedure except in the discussion of drug dosing where results were compared with eGFR(C-G) after individualisation using the anthropometric data by the National Survey of Health of the Swedish Institute for Public Health 2009 ( Table 1 ):
The body surface area (BSA) was estimated by the du Bois algorithm.[11]

where M is the body weight in kg, H is the height in cm. The result is expressed in m2.
Normalisation of the eGRFInd is relating the clearance to a 'normal' person with a BSA of 1.73 m2. Accordingly, eGFRNorm and eGFRInd will coincide, the BSA is close to 1.73 m2 ( Table 1 ).
Table 1. Anthropometric data from The National Survey of Health and the calculated body surface area (BSA).
| Age years | Weight, kg | Height, cm | BSA, m2 | |
|---|---|---|---|---|
| Men | 45 | 85 | 180 | 2.05 |
| 55 | 84 | 180 | 2.04 | |
| Women | 45 | 67 | 167 | 1.75 |
| 55 | 69 | 165 | 1.76 |
Table 2. eGFR from S-Creatinine of 110 μmol/L.The influence of anthropometric data on the transformation between eGFRInd and eGFRNorm and vice versa is exemplified ( Table 2 ).
| LMOrig | LMRev | MDRD | CKD-EPI | C-G | |
|---|---|---|---|---|---|
| GFRNorm | 58 | 62 | 60 | 65 | 68 |
| eGFRInd (84 kg) | 68 | 73 | 71 | 77 | 80 |
| eGFRInd (100 kg) | 74 | 79 | 76 | 83 | 95 |
ResultsThere is no ethical concern in the present study.
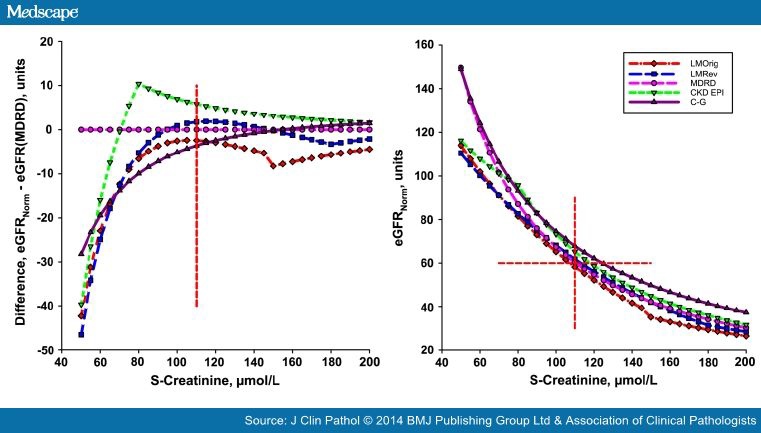
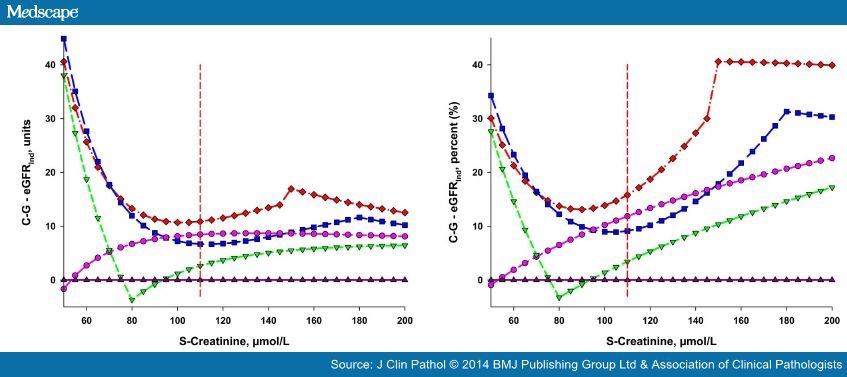
The eGFRNorm versus S-Creatinine are shown in the measuring interval (50–200 μmol/L) at the age 55 years (Figure 1, left panel). Compared with MDRD (Figure 1 right panel), the C-GNorm gave higher values (about +7.5%), and those of the CKD-EPI and LMRev approached the MDRD values within the measuring interval. The LMOrig estimates are close to those of the MDRD at a S-Creatinine of 110 μmol/L but deviates more at higher S-Creatinine (about −7.5%), until the discontinuity of the algorithm is reached. At the suggested cut-off the maximum difference between the algorithms is 7 units. The cut-off for 'stage III' kidney disease is 60 units, irrespective of the algorithm used. This will be obtained at a S-Creatinine of 107 μmol/L, 110 μmol/L, 113 μmol/L and 118 μmol/L and 145 μmol/L applying LMOrig, MDRD, LMRev, CKD-EPI and C-GNorm, respectively (figure 1A).
At a constant S-Creatinine of 110 μmol/L and an eGFRNorm of 60 units the effect of age can be shown (figure 2). The CKD-EPI and MDRD displayed slightly concave curves whereas the LMOrig and LMRevwere convex, resulting in different effects on the change of eGFR per year at higher ages. During the interval 45–65 years the change was close to linear indicating an eGFR decrease of about 6% per decade for CKI-EDI, 2.5% for MDRD, 10% for LMOrig and LMRev, and 12% for C-GNorm. This change over time is approximate but changes very little in the S-Creatinine interval 90–130 μmol/L.
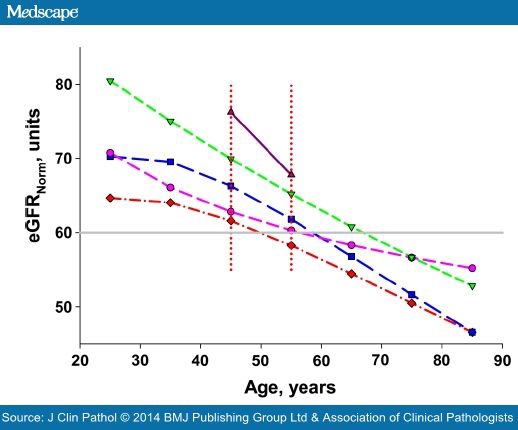
Figure 2 also indicates that in relation to age, at a S-Creatinine of 110 μmol/L the LMOrig indicates an eGFR of 60 units at about 50 years, whereas the same eGFR is not reached until the age of 70 years if the CKD-EPI is employed. At 50 years the CKD-EPI would show an eGFR of about 70 units.
The absolute and relative differences between recalculated eGFRNorm and eGFR(C-GInd) are shown in Figure 3 and Table 3 . The relative deviations were calculated using the eGFR obtained by the respective algorithms.
Discussion
In steady state, the substance flow (the numerator in formula 3; mmol/min) of endogenous substances through the glomerular membrane equals their production (absorption) if there were no other excretion pathways. An impaired filtration may result in an increased concentration of the substance on the primary side of the membrane (denominator in formula 3) to maintain the substance flow. Clearance can be expressed as the substance flow relative to the serum concentration and expressed as volume rate, mL/min.[12] Therefore, an increased substance concentration on the primary side (serum or plasma) and a retained substance flow causes the clearance to decrease.
Creatinine clearance is thus inversely proportional to S-Creatinine with the substance flow as the proportionality factor. Multivariate regression analysis allows including variables that have an impact on clearance and the regressions are therefore not as simple as outlined in formula 3. The different algorithms use different models and thus the regression functions may differ even if the analysis were applied to the same patient cohort.
Algorithms and regression functions are a kind of average, summarising a relation between pairs of values. As with all summary statistics, eGFR algorithms cannot accurately forecast the GFR for a particular individual from the independent variable (S-Creatinine), and can only give an epidemiological or population-based 'average'.
The algorithms give comparable values for a given S-Creatinine in the clinically important interval (Figure 1). In evaluating the clinical significance of this difference a measurement uncertainty of S-Creatinine (typically 3–6%) should be considered. It should be noted that the result is uncoupled, that is, without taking the individual patient's features, which may influence the S-Creatinine, into account.
The CKD-EPI, LMOrig and LMRev show discontinuities in the regression function; the CKD-EPI at a low (81 μmol/L), may be clinically rather unimportant S-Creatinine. In the LMOrig and LMRev, the discontinuities occur at concentrations consistent with kidney dysfunction, that is, 150 μmol/L and 180 μmol/L, respectively. The resulting jump in the results may be a potential hazard in monitoring disease using the LMOrig and LMRev whereas it may be of less importance for the CKD-EPI.
In describing the performance of a method the laboratorian will focus on the uncertainty of the result, which describes an interval within which a true value is expected with a certain probability. The uncertainty elimination of any known systematic difference, for example, by using suitable calibrators and reagents is accompanied by a further increase of the combined uncertainty. The measurement uncertainty of a S-Creatinine result is usually 3–6% with a probability of 95%. It is unavoidable that an algorithm increases the uncertainty; the increase depends on the regression function and the uncertainty of the comparative method. The comparative exogenous clearance estimates are also based on population-based regression functions and liable to several sources of uncertainty, for example, the distribution volume of the marker substance in the individual.
Clinicians may prefer to describe the performance differently. Clinical and Laboratory Standards Institute in USA[13] describes the 'A-zone' as a zone around the equal line in a method comparison. This is where most pairs are expected. Stevens et al [14] showed that to include about 82% of the results in the A-zone of eGFR (MDRD) and eGFR(C-G), compared with GFR (iothalamate), this zone requires a width of about ±30% (P30); that is, an eGFR of 60 units would be associated with an uncertainty interval from 42 units to 78 units. The difference between the calculated and reference measurements will still be larger than ±30% in about 18% of cases.
As a comparison a glucometer compared with a reference method for P-Glucose requires that 95% of the results are within ±5% from the equal line to be acceptable.
We cannot, with any degree of confidence, calculate the uncertainty of an individual result of eGFR and therefore not estimate the minimal significant difference[15] between two consecutive results.
When applied to our patient of 55 years, the difference between the algorithms at 60 MDRD units was less than 7.5 units (figure 1), far less than the A-zone. The algorithm suggested by Jelliffe in 1973[4]differs less than 5% from MDRD in the interval 90–150 μmol/L, for example, 6 units at 120 μmol/L.
The 'slope' (figure 1) of the response curves shows a larger numerical change in S-Creatinine than in eGFR, thus the resolution of S-Creatinine is larger than that of eGFR. An increase of S-Creatinine from 80 μmol/L to 160 μmol/L corresponds to a change of MDRD from 87 units to 39 units, only a mere 60% of the change in S-Creatinine. The larger uncertainty associated with the eGFR will emphasise the sensitivity of S-Creatinine in relation to eGFR. Therefore, our results support the conclusion by Dalton[16]that there is no 'creatinine-blind interval'.[17]
The set point for staging CKD is supposed to be global irrespective of the creatinine measurement procedure, the algorithm used, the age and the gender. Our results (figure 1) indicate that the algorithms will give essentially the same values but the age factors do not neutralise the physiological effect of age, that is, warrant the same cut-off for all ages (figure 2). The validity of the set point therefore depends on the calibration of the measurement and which age and gender factors applied. In spite of major international harmonising efforts, that is, introduction of traceable calibrators, standardisation of measurement principles (kinetic vs enzymatic) and procedures (analytical platforms) a considerable interlaboratory variation may be present. An actual and global account on the interlaboratory variation is not available.
S-Creatinine shows considerable interindividual variation,[18] partly related to relative muscle mass, choice of food and physical activities.[19] This is also illustrated by the large CI of population-based reference intervals[20] The large ratio between the biological interindividual and intraindividual variations (CVG and CVI, respectively; analytical variation CVA) was discussed by Fraser[21,22] and Harris introduced the 'index of individuality' (InIx),[23]
A large InIx, above about 1.4, by convention, indicates that a population-based reference interval can be established whereas an InIx below 0.6 makes population-based reference intervals less useful. The InIx of S-Creatinine has been estimated to about 0.3.[22,24] Since eGFR is calculated from S-Creatinine it is likely that the InIx of eGFR will be similar. Therefore it is unlikely that a globally applicable decision value of eGFR can be given.
Clearance is normalised to the BSA, to improve the comparability of results but the eGFR algorithms do not consider anthropometric data—except the eGFR(C-G). The regressions may have been established between S-Creatinine and normalised GFR by the comparative procedure, but since no anthropometric data is used in the algorithm when applied to an individual, the result cannot be truly 'normalised'. We therefore prefer to simply use 'unit' for eGFRNorm.
The eGFR(C-G) was recommended by FDA in 1998 and 2011[25,26] for drug dosing guidance. It has been used by manufacturers and clinicians as a surrogate for monitoring the serum concentration of the drug and translated to dosage recommendations. eGFRNorm needs to be transformed to eGFRInd by applying the individual's BSA.
In our simulations, the conversion of eGFRNorm indicates that an underdosage of the drug may be caused since the converted values are higher than the eGFR(C-G) (figure 3). This is consistent with the recent findings by Dias et al who compared the MDRD and CKD-EPI algorithms with 99mTc-DTPA clearance.[27]In the elderly, however, a risk for over-dosing of dabigatran was described by Helldén et al. [28]MacCallum et al [29] also described a potential overdosage of dabigatran and rivaroxaban, using MDRD-derived eGFR.


 留言列表
留言列表
 線上藥物查詢