JAMA Intern Med. Published online March 10, 2014. doi:10.1001/jamainternmed.2014.136
Abstract
Importance Detailed, nationally representative data describing high-risk populations and circumstances involved in insulin-related hypoglycemia and errors (IHEs) can inform approaches to individualizing glycemic targets.
Objective To describe the US burden, rates, and characteristics of emergency department (ED) visits and emergency hospitalizations for IHEs.
Design, Setting, and Participants Nationally representative public health surveillance of adverse drug events among insulin-treated patients seeking ED care (National Electronic Injury Surveillance System–Cooperative Adverse Drug Event Surveillance project) and a national household survey of insulin use (the National Health Interview Survey) were used to obtain data from January 1, 2007, through December 31, 2011.
Main Outcomes and Measures Estimated annual numbers and estimated annual rates of ED visits and hospitalizations for IHEs among insulin-treated patients with diabetes mellitus.
Results Based on 8100 National Electronic Injury Surveillance System–Cooperative Adverse Drug Event Surveillance cases, an estimated 97 648 (95% CI, 64 410-130 887) ED visits for IHEs occurred annually; almost one-third (29.3%; 95% CI, 21.8%-36.8%) resulted in hospitalization. Severe neurologic sequelae were documented in an estimated 60.6% (95% CI, 51.3%-69.9%) of ED visits for IHEs, and blood glucose levels of 50 mg/dL (to convert to millimoles per liter, multiply by 0.0555) or less were recorded in more than half of cases (53.4%). Insulin-treated patients 80 years or older were more than twice as likely to visit the ED (rate ratio, 2.5; 95% CI, 1.5-4.3) and nearly 5 times as likely to be subsequently hospitalized (rate ratio, 4.9; 95% CI, 2.6-9.1) for IHEs than those 45 to 64 years. The most commonly identified IHE precipitants were reduced food intake and administration of the wrong insulin product.
Conclusions and Relevance Rates of ED visits and subsequent hospitalizations for IHEs were highest in patients 80 years or older; the risks of hypoglycemic sequelae in this age group should be considered in decisions to prescribe and intensify insulin. Meal-planning misadventures and insulin product mix-ups are important targets for hypoglycemia prevention efforts.
Insulin is a cornerstone of type 1 diabetes mellitus (DM) treatment and is increasingly introduced early in the treatment course for patients with type 2 DM, who account for 90% to 95% of new DM cases annually.1 During the last decade, the number of US patients with insulin-treated DM rose 50%; one-third of patients with diabetes currently use insulin,2 and in 2012, insulin was estimated to cost the US health care system approximately $6 billion.3 Tight glycemic control with insulin has been associated with reductions in disease complications among patients with type 1 DM4 but has been increasingly associated with harms among patients with type 2 DM.5- 7 Insulin remains one of the most challenging and limiting aspects of DM medical management owing to complexities in dosing and administration, as well as the need for routine monitoring of blood glucose (BG) and food intake to avoid potentially fatal hypoglycemia.8 The risk of insulin-related hypoglycemia is an important consideration when choosing among treatment options and individualizing glycemic targets, particularly in patients for whom benefits of intensive control are not as likely to be realized.9,10
We used recent, nationally representative data from 2007 through 2011 to estimate the burden and rates of insulin-related hypoglycemia and errors (IHEs) resulting in emergency department (ED) visits and subsequent hospitalizations, and identify high-risk groups and precipitating factors for IHEs.
Methods
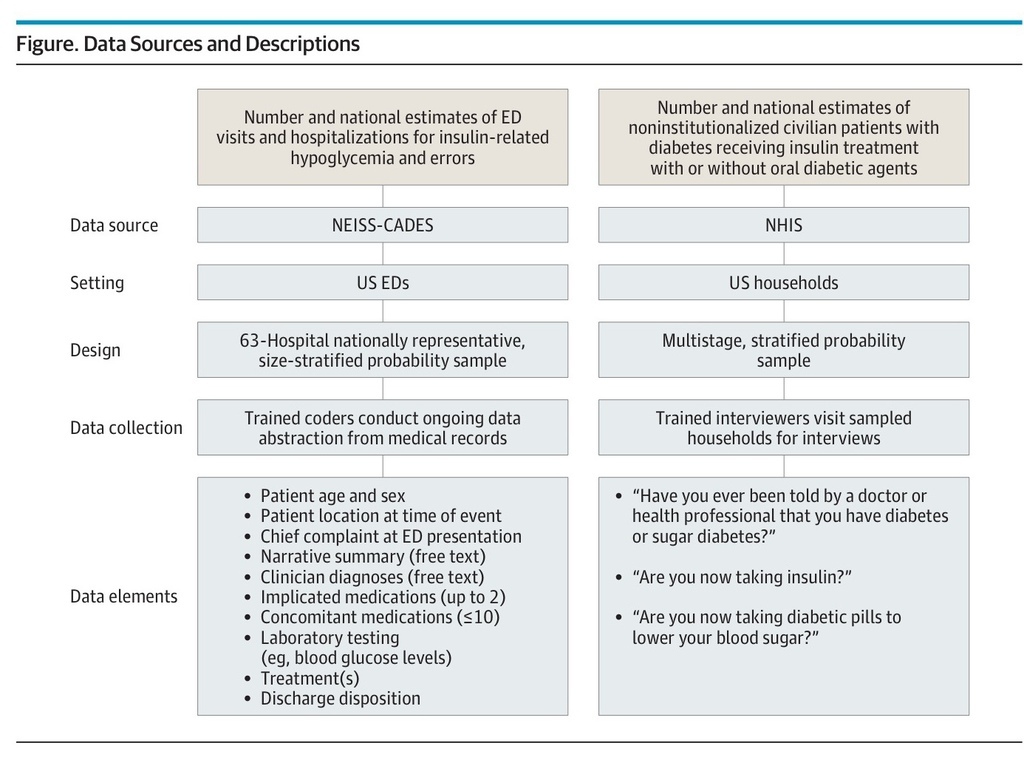
We estimated the number of US ED visits and hospitalizations for IHEs based on data from the 63 hospitals participating in the National Electronic Injury Surveillance System–Cooperative Adverse Drug Event Surveillance (NEISS-CADES) project, a stable, nationally representative, size-stratified probability sample of hospitals (excluding psychiatric and penal institutions) in the United States and its territories with a minimum of 6 beds and a 24-hour ED (Figure).11 As described elsewhere,12 trained coders at each hospital review clinical records of every ED visit to identify physician-diagnosed adverse drug events (ADEs) and report up to 2 medications implicated in the adverse event as well as any concomitant medications documented in the medical record. Coders also record narrative descriptions of the ADE, including preceding events, physician diagnosis, clinical and laboratory testing, treatment administered by emergency medical services (EMS) or ED staff, and discharge disposition.
Figure.
Data Sources and Descriptions
For the National Health Interview Survey (NHIS), the Core questionnaire (Sample Adult and Sample Child components) was used. Results from persons who answered that they have “borderline” diabetes are treated as unknown. For female NHIS respondents, the first question begins with the phrase “Other than during pregnancy.” For persons younger than 18 years, the questions about diabetes therapy are not asked; for this age group, the prevalence of diagnosed diabetes was used as a proxy for national estimates of insulin treatment. ED indicates emergency department; NEISS-CADES, National Electronic Injury Surveillance System–Cooperative Adverse Drug Event Surveillance.
We estimated the number of US patients who reported having DM and using insulin or oral antidiabetic agents from the National Health Interview Survey (NHIS), a multistage cluster sample of noninstitutionalized civilian households (Figure).13
Data collection for the NEISS-CADES project is considered a public health surveillance activity by federal human subjects oversight bodies and does not require human subject review or institutional review board approval.14 Data collection for the NHIS is approved by the institutional review board at the National Center for Health Statistics, Centers for Disease Control and Prevention. No approval is necessary for analyses of deidentified survey data.15
Emergency department visits for IHEs included visits to any NEISS-CADES ED from January 1, 2007, through December 31, 2011, in which there was clinician documentation of (1) insulin-related clinically relevant hypoglycemia (BG <70 mg/dL [to convert to millimoles per liter, multiply by 0.0555], diagnosis of “hypoglycemia,” or treatment for hypoglycemia), (2) “insulin overdose” or “insulin reaction,” or (3) an error in insulin use (eg, administration of the wrong insulin dose). Visits for allergic reactions, local effects (eg, injection site pain), nonhypoglycemic effects (eg, headache alone), and accidental needle sticks were excluded. Definitions of other variables, including IHE location, clinical presentation, BG levels, hypoglycemia treatments, diabetes therapy, and precipitating factors are provided in eTable 1 in the Supplement.
The prevalence of self-reported diabetes from January 1, 2007, through December 31, 2011, was estimated from the number of NHIS respondents who answered yes to the question, “Have you ever been told by a doctor or health professional that you have diabetes or sugar diabetes?”16- 18 For those at least 18 years old, the prevalence of insulin-treated diabetes was estimated by the number of NHIS respondents who answered yes to the question, “Are you now taking insulin?” For those younger than 18 years, this question is not asked; thus, prevalence of diagnosed diabetes was used as a proxy for insulin treatment. Insulin-treated patients were considered to be treated with both insulin and oral antidiabetic agent(s) if they also answered yes to the question, “Are you now taking diabetic pills to lower your blood sugar?”
Each NEISS-CADES record is accompanied by a sample weight based on inverse probability of selection, adjusted for nonresponse and hospital nonparticipation, and poststratified to account for changes in the number of US ED visits each year. Each NHIS record is accompanied by a sample weight based on nonzero probability of selection, with design, ratio, nonresponse, and poststratification adjustments; poststratification adjustment is made relative to census control totals for the number of US civilian, noninstitutionalized individuals.19
National estimates and proportions of ED visits and hospitalizations for IHEs and national estimates of patients with diabetes using insulin alone or in combination with oral antidiabetic agents, with corresponding 95% CIs, were calculated using the SURVEYMEANS procedure in SAS software (version 9.3; SAS Institute) to account for the sample weights and complex sample designs. Estimates and their corresponding 95% CIs derived from 2007-2011 NEISS-CADES and NHIS data were divided by 5 to obtain average annual estimates and 95% CIs. Estimates based on small numbers of cases (<20) or with a coefficient of variation greater than 30% were considered statistically unstable and are noted in the tables. National estimates were calculated for variables with completed documentation (≥90% of cases); case-based analysis was used for the remaining variables.
To estimate rates of ED visits and hospitalizations for IHEs in relation to insulin exposure, we divided NEISS-CADES–derived estimates of ED visits or hospitalizations for IHEs by NHIS-derived estimates of insulin-treated patients. A similar approach was used to estimate the rates of IHEs by age and sex. Accompanying 95% CIs were calculated accounting for variability in both numerator and denominator estimates and assuming statistical independence (as these components were derived from separate surveys).20 These rate estimates were then used to calculate rate ratios (RRs) of ED visits and hospitalizations for IHEs associated with different patient groups. Estimated 95% CIs for RRs were calculated using an initial logarithmic transformation and incorporated the estimated variances of the numerators and denominators of both component rate estimates, which were assumed to be independent across patient populations.21
Results
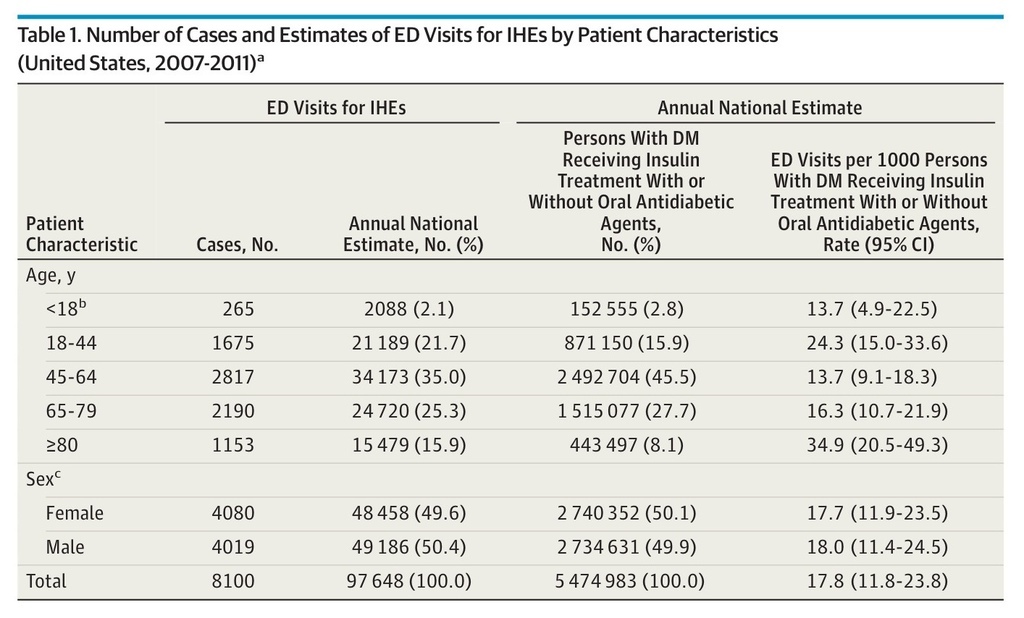
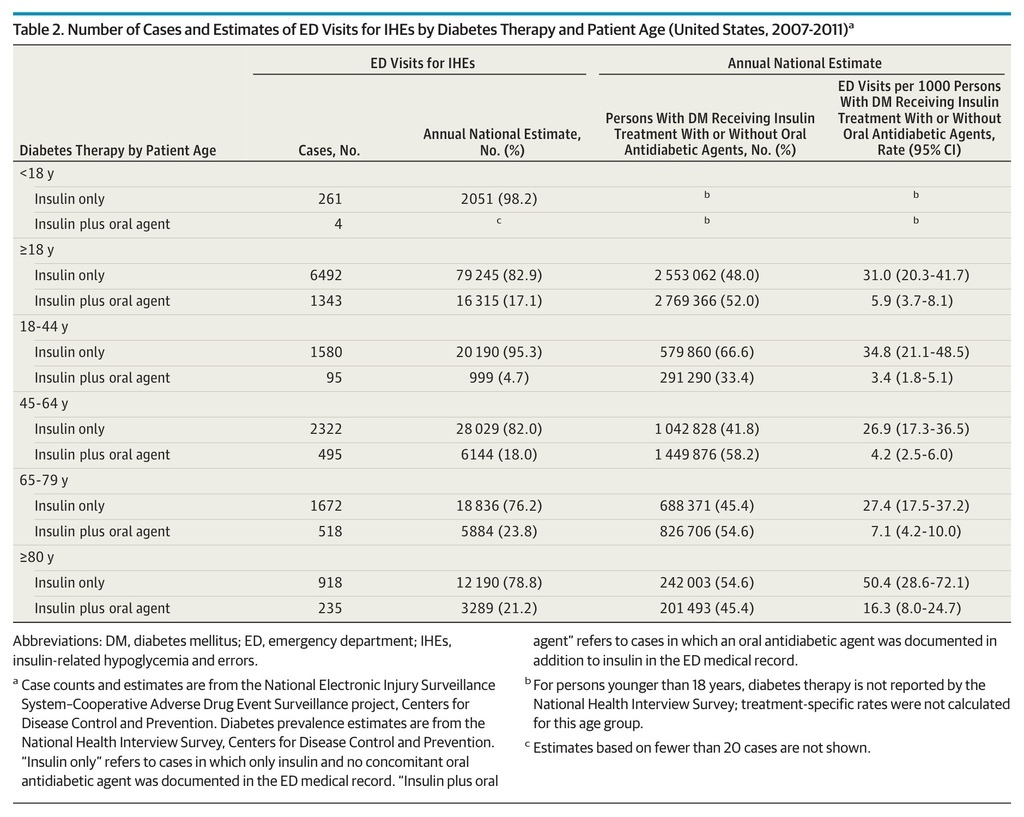
Based on 8100 NEISS-CADES surveillance cases, an estimated 97 648 (95% CI, 64 410-130 887) ED visits for IHEs occurred annually between 2007 and 2011 (Table 1), accounting for 9.2% (95% CI, 6.7%-11.8%) of ED visits for all ADEs during this period. Among the very elderly (≥80 years), ED visits for IHEs accounted for 12.4% (95% CI, 8.9%-16.0%) of ED visits for all ADEs. The estimated median age of patients who presented to EDs for IHEs was 60 years for patients treated with insulin alone and 67 years for patients treated with insulin and at least 1 oral antidiabetic agent. An estimated 50.4% (95% CI, 46.4%-54.3%) of ED visits for IHEs occurred among male patients. Among adults (≥18 years), at least 1 oral antidiabetic agent was documented in addition to insulin in an estimated 17.1% (95% CI, 13.3%-20.8%) of ED visits for IHEs (Table 2).
Table 1. Number of Cases and Estimates of ED Visits for IHEs by Patient Characteristics (United States, 2007-2011)a
Table 2. Number of Cases and Estimates of ED Visits for IHEs by Diabetes Therapy and Patient Age (United States, 2007-2011)a
Patients 80 years or older had the highest estimated rate of ED visits for IHEs (34.9 per 1000 insulin-treated patients with diabetes; 95% CI, 20.5-49.3), followed by patients 18 to 44 years (24.3 per 1000; 95% CI, 15.0-33.6). When all patients 65 years or older are considered, the estimated rate was 20.5 per 1000 (95% CI, 13.2-27.8). Insulin-treated patients 80 years or older were more than twice as likely to seek ED evaluation for IHEs than those 65 to 79 years (RR, 2.1; 95% CI, 1.3-3.7) and those 45 to 64 years (RR, 2.5; 95% CI, 1.5-4.3) (Table 2). Patients in the oldest group were also almost 5 times as likely to be hospitalized for IHEs as those 45 to 64 years (RR, 4.9; 95% CI, 2.6-9.1). There were no significant differences identified between female and male patients in the rates of ED visits (RR, 1.0; 95% CI, 0.6-1.6) or hospitalizations (RR, 1.2; 95% CI, 0.6-2.1) for IHEs. Overall, the rate of ED visits for IHEs among patients at least 18 years old treated with insulin only was 5 times that of patients treated with insulin and at least 1 oral antidiabetic agent (RR, 5.3; 95% CI, 3.2-8.8); the RR decreased as patient age increased (Table 2).
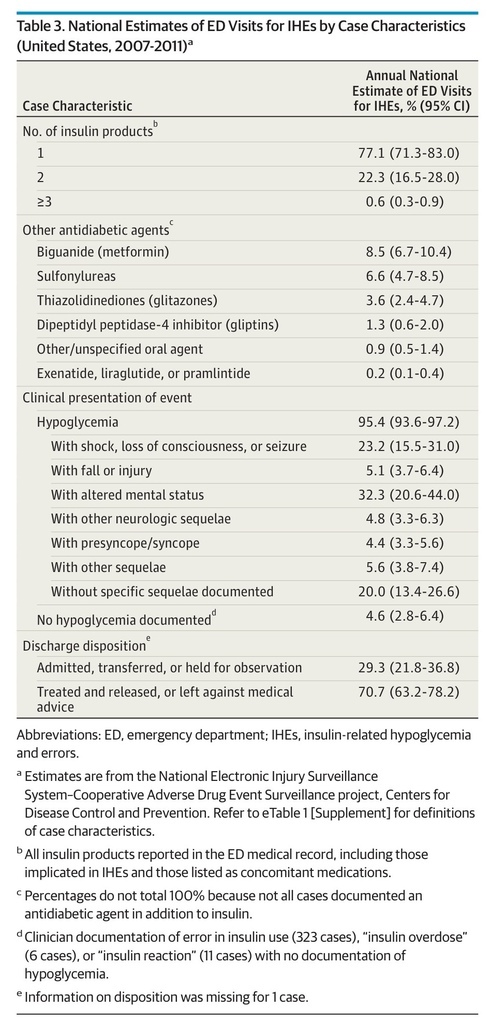
In an estimated 22.9% of ED visits for IHEs, more than 1 type of insulin product was documented in the medical record (Table 3). Long-acting (32.9%) and rapid-acting (26.4%) products were the most commonly documented insulin product types (eTable 2 in the Supplement). Metformin and sulfonylureas were the most commonly documented concomitant oral antidiabetic agents, identified in 50.9% (95% CI, 47.6%-54.2%) and 39.2% (95% CI, 34.8%-43.6%), respectively, of estimated ED visits for IHEs at which an oral antidiabetic agent was documented.
Table 3. National Estimates of ED Visits for IHEs by Case Characteristics (United States, 2007-2011)a
Hypoglycemia was documented in an estimated 95.4% of ED visits for IHEs, and severe neurologic sequelae (ie, hypoglycemia-associated shock, loss of consciousness, or seizure; hypoglycemia-associated injury or fall; or hypoglycemia-associated altered mental status) were documented in an estimated 60.6% (95% CI, 51.3%-69.9%) (Table 3). Almost one-third (29.3%) of estimated ED visits for IHEs required admission, transfer to another facility, or observation admission; observation admissions comprised 2.1% (95% CI, 0.9%-3.3%) of estimated ED visits.
In most cases (53.3%), IHEs occurred in a home setting (eTable 2 in the Supplement). Use of an insulin pump was documented in 6.1% of cases. More than half (53.4%) of cases involved a BG level of 50 mg/dL or less. Intravenous dextrose 50% was the most common EMS/ED treatment administered (50.8% of cases).
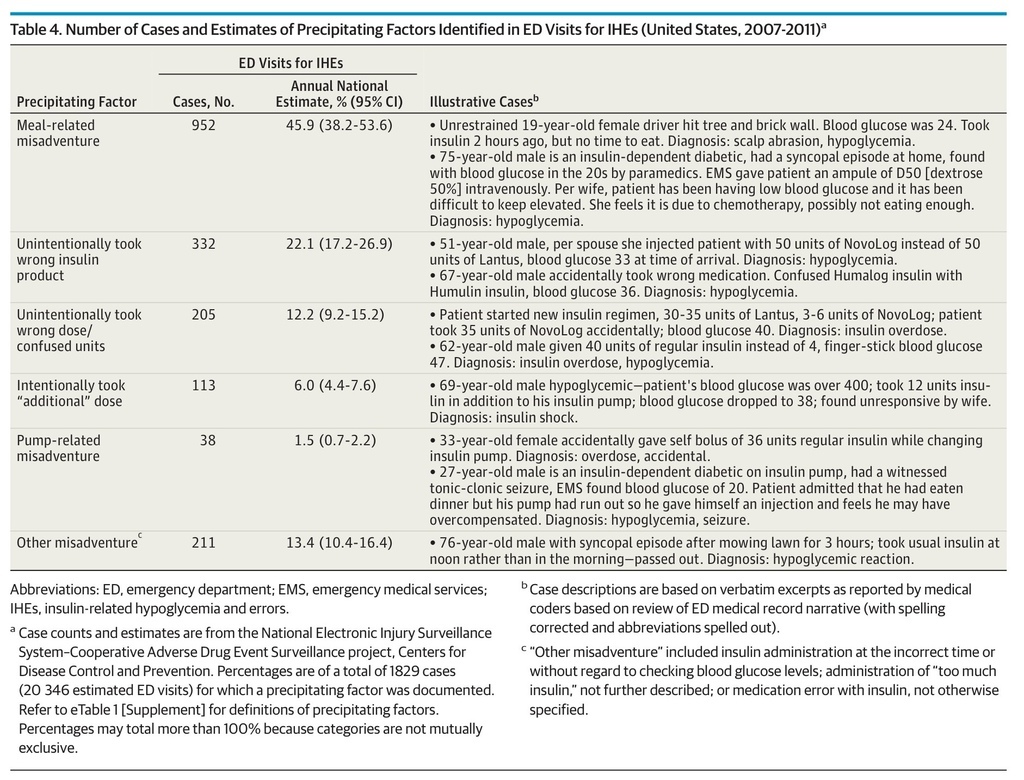
Precipitating factors for ED visits for IHEs were documented in an estimated 20.8% (95% CI, 14.8%-26.9%) of ED visits. When documented, almost half (45.9%) involved meal-related misadventures (eg, neglecting to eat shortly after taking a rapid-acting insulin or not adjusting insulin regimen in the presence of reduced caloric intake) (Table 4). An estimated 22.1% of ED visits for IHEs with documented precipitants involved taking the wrong insulin product, and 12.2% involved taking the wrong dose or confusing dosing units. Among ED visits for IHEs at which taking the wrong insulin was documented, the most commonly reported error was mixing up long-acting and rapid-acting insulin products. In an estimated 52.3% of these ED visits (95% CI, 42.5%-62.0%), patients reported an intent to take a long-acting insulin product (eg, insulin detemir or insulin glargine) but took a rapid-acting one (eg, insulin aspart or insulin lispro) instead. The proportion hospitalized did not differ among ED visits at which an IHE precipitant was documented (20.7%; 95% CI, 15.9%-25.4%) compared with visits where none was documented (31.6%; 95% CI, 22.9%-40.2%).
Table 4. Number of Cases and Estimates of Precipitating Factors Identified in ED Visits for IHEs (United States, 2007-2011)a
Discussion
Insulin is an important component of diabetes treatment but remains complex to manage and poses serious risk of hypoglycemia.22 These national data quantify the burden and severity of IHEs, identify patient groups at higher risk for these events, and describe precipitating factors that could be targeted by prevention efforts.
Nearly 100 000 ED visits and 30 000 hospitalizations annually for IHEs demonstrate the high frequency and significant health effects of these adverse events. Based on prior cost estimates of ED visits for hypoglycemia,23 ED visits for IHEs may have cost well over $600 million during the 5-year study period. Direct comparisons of our findings with those of previous studies are limited by methodologic differences among studies. Investigators in one study estimated 40 700 ED visits for insulin and other antidiabetic agent–related adverse events in 2010, using International Classification of Diseases, Ninth Revision, Clinical Modification, diagnosis codes for poisoning (962.3) or adverse effects due to insulin or other antidiabetic agents (E932.3)24; however, such cause-of-injury codes have low sensitivity for identifying many ADEs.25 Investigators in another study estimated that 316 000 visits for hypoglycemia were made to US EDs in 2007, an estimate based on the reporting of hypoglycemia as the first-listed diagnosis and diabetes as a secondary diagnosis26; however, this analysis lacked information on insulin use and could not exclude hypoglycemia episodes related to other factors (eg, alcohol use or occult infection).
The IHEs we identified were serious events, with BG levels of 50 mg/dL or less in more than half of cases and severe neurologic manifestations in almost two-thirds. A previous study27 based on NEISS-CADES found insulin to be one of the most commonly implicated drugs in adverse events treated in EDs. Based on the more recent data in this study, IHEs accounted for 1 of every 8 estimated ED visits for ADEs among the very elderly (≥80 years), who sought ED evaluation and were hospitalized for IHEs at rates 2 and 5 times higher, respectively, than those 45 to 64 years. Other studies have found that Medicare beneficiaries 85 years or older are twice as likely to experience a hypoglycemia-related hospitalization than those 65 to 74 years,28 and that rehospitalizations and deaths are more frequent among older adults (≥66 years) with at least 1 episode of hospitalized hypoglycemia.29
Although there are notable exceptions,30- 33 until very recently, most diabetes treatment guidelines, quality metrics, and pay-for-performance measures placed little emphasis on hypoglycemia risk factors, such as advanced age, limited life expectancy, or frailty.34 The higher rates of ED visits and hospitalizations for IHEs among older insulin-treated patients with diabetes suggest that individualizing glycemic targets by balancing hypoglycemia risks with long-term benefits of glycemic control is appropriate.22,35- 37 Updated guidelines and treatment recommendations are now advising that glycemic targets be relaxed for patients with advanced age, high risk of hypoglycemia, or shorter life expectancy.22,35,38,39 For example, the American Geriatrics Society has advocated for avoiding use of medications to achieve tight hemoglobin A1c control in most adults 65 years or older.40,41 Tighter glycemic control may continue to be appropriate for functional and cognitively intact elderly patients with diabetes who have longer life expectancy and for whom intensive insulin therapy can be managed safely22,35; however, the high frequency and severity of ED visits for IHEs suggest careful consideration of hypoglycemic sequelae and a cautious approach when deciding whether to start or intensify insulin treatment among older adults, especially the very elderly.
Adoption of a patient-centered approach to setting glycemic targets9,10,42- 44 also requires development of health care quality metrics that recognize targets based on individual patients’ clinical profiles and preferences.33 Although current National Quality Forum–endorsed quality metrics do not yet incorporate variation in hemoglobin A1c target levels based on hypoglycemia risk,45,46 new quality metrics might allow consideration of hypoglycemia risks along with long-term benefits of glycemic control.47
Enhanced prevention efforts should target commonly identified IHE precipitants.48 Although meal planning is a well-recognized component of diabetes self-management education,49,50 the most commonly documented IHE precipitant in this study was meal-related misadventure, suggesting that further emphasis on meal planning in diabetes patient education efforts may be needed. Reducing the frequency of missed meals and improving patients’ competency in adjusting insulin regimens when food intake is reduced may require content review (eg, reviewing patients’ understanding of dietetic needs in relation to BG levels) and simulation (eg, having patients demonstrate how they would manage insulin with a missed meal or reduced food intake scenario).48,51
Administration of the wrong insulin product (eg, rapid-acting vs long-acting agents) was the second most commonly documented IHE precipitant. The number of US poison control center calls for insulin-related unintentional therapeutic errors increased in the last decade, but the frequency of specific errors, such as using the wrong insulin product, has not been described.52,53 Insulin packaging has become more distinguishable than in the past54; however, mix-ups continue55 and further product-type distinctions (eg, using packaging color or texture) might be explored for reducing medication errors. In addition, diabetes self-management education might emphasize distinguishing insulin types, minimizing mix-ups (eg, storing rapid-acting and long-acting agents in different locations), and correctly timing insulin administration.54,56
Our findings should be interpreted in the context of the limitations of public health surveillance data. First, these data probably underestimate the total burden of hypoglycemic events because hypoglycemia, although a frequent cause of EMS calls,57- 61 is most often cared for outside the ED setting.62 Patients who have hypoglycemia unawareness63,64 and whose episodes do not result in EMS or ED care are not counted, nor are those who died en route to or in the ED. Second, because medical history information is limited in the ED medical record, the contributions of risk factors for hypoglycemia (eg, DM type, intensity and duration of insulin therapy, glycemic control, concomitant medications, and comorbid conditions) were not assessed. Third, the specific insulin brand, formulation, and delivery system were not always documented, which limited the ability to assess differences in ED visits and hospitalizations for IHEs across specific insulin products. Similarly, we did not make detailed comparisons between patients treated with insulin alone and those treated with insulin and oral antidiabetic agent(s) because documentation of concurrent oral diabetes therapy may have been incomplete. Nonetheless, it is notable that across all adult age groups the rate of estimated ED visits for IHEs was consistently lower among those treated with concurrent oral diabetes therapy, perhaps suggesting concurrent use of long-acting insulin products, with less risk for hypoglycemia.65 Fourth, BG levels were not specified in approximately one-third of cases; nevertheless, more than half still had documented BG levels of 50 mg/dL or less. Other indicators of the seriousness of these events included almost 60 000 estimated ED visits for IHEs with severe neurologic sequelae and almost 30 000 resulting in hospitalization.
Conclusions
Insulin-related hypoglycemia and errors are clinically significant causes of ED visits and hospitalizations for ADEs, particularly among very elderly patients with diabetes. Reducing ED visits for adverse events related to injectable antidiabetic agents has been recognized as a national priority for improving the health of Americans in a new Healthy People 2020 goal.66 Reaching this goal will probably require balancing glycemic risks in vulnerable older patient populations and augmenting prevention efforts targeted at key IHE precipitants, such as meal-related misadventures and insulin product mix-ups. Health care quality metrics should evolve based on the most current glycemic control guidelines, and the effects of changing guidelines, quality metrics, and prevention strategies should be evaluated by means of ongoing national surveillance.




 留言列表
留言列表
 線上藥物查詢