

_.jpg")
Andreas L. Serra, M.D., Diane Poster, M.D., Andreas D. Kistler, M.D., Fabienne Krauer, B.S., Shagun Raina, M.S., James Young, Ph.D., Katharina M. Rentsch, Ph.D., Katharina S. Spanaus, M.D., Oliver Senn, M.D., M.P.H., Paulus Kristanto, Ph.D., Hans Scheffel, M.D., Dominik Weishaupt, M.D., and Rudolf P. Wüthrich, M.D.
Methods In this 18-month, open-label, randomized, controlled trial, we sought to determine whether sirolimus halts the growth in kidney volume among patients with ADPKD. We randomly assigned 100 patients between the ages of 18 and 40 years to receive either sirolimus (target dose, 2 mg daily) or standard care. All patients had an estimated creatinine clearance of at least 70 ml per minute. Serial magnetic resonance imaging was performed to measure the volume of polycystic kidneys. The primary outcome was total kidney volume at 18 months on blinded assessment.Secondary outcomes were the glomerular filtration rate and urinary albumin excretion rate at 18 months.
Results At randomization, the median total kidney volume was 907 cm3 (interquartile range, 577 to 1330) in the sirolimus group and 1003 cm3(interquartile range, 574 to 1422) in the control group. The median increase over the 18-month period was 99 cm3 (interquartile range, 43 to 173) in the sirolimus group and 97 cm3 (interquartile range, 37 to 181) in the control group. At 18 months, the median total kidney volume in the sirolimusgroup was 102% of that in the control group (95% confidence interval, 99 to 105; P=0.26). The glomerular filtration rate did not differ significantly between the two groups; however, the urinary albumin excretion rate was higher in the sirolimus group.
Conclusions In adults with ADPKD and early chronic kidney disease, 18 months of treatment with sirolimus did not halt polycystic kidney growth. (ClinicalTrials.gov number, NCT00346918 [ClinicalTrials.gov] .)
Autosomal dominant polycystic kidney disease (ADPKD) is the most frequent hereditary kidney disease and the cause of end-stage renal disease in 7 to 10% of all patients undergoing dialysis.1,2,3 The disease is characterized by the growth of numerous kidney cysts, which leads to progressive destruction of the adjacent renal parenchyma and massive enlargement of the kidneys.4 Renal function is often preserved until the age of 40 years because functioning nephrons undergo compensatory hypertrophy.5 Subsequently, the glomerular filtration rate (GFR) decreases, and end-stage renal disease ensues in many patients by the fifth decade. As yet, no treatment is available to delay disease progression.6
The main pathogenic features of ADPKD are enhanced tubular-cell proliferation, fluid secretion, and the formation of cysts along all segments of the nephron.7,8 The mammalian target of rapamycin (mTOR) is aberrantly activated in cystic epithelia in patients with ADPKD.9 Sirolimus inhibits mTOR, and in an orthologous mouse model of ADPKD10 and other rodent models of polycystic kidney disease,11,12,13,14,15,16,17,18 sirolimus significantly improved renal cystic disease. Whether sirolimus improves renal cystic disease in humans with ADPKD has not been determined. On the basis of evidence that mTOR inhibitors were highly effective in preclinical studies, we conducted a randomized, open-label, controlled, single-center trial, called the Suisse ADPKD study, to test whether sirolimus would retard kidney-volume growth in adults with ADPKD in the early stages of chronic kidney disease.
Methods
Eligibility
Adults with a diagnosis of ADPKD19 were eligible to enroll in the trial if they were between the ages of 18 and 40 years and had an estimated creatinine clearance of at least 70 ml per minute with the use of the Cockcroft–Gault equation.20 The major exclusion criteria were an increased level of liver enzymes (more than two times the upper reference limit), a fasting total cholesterol level of more than 8 mmol per liter (309 mg per deciliter), a triglyceride level of more than 5 mmol per liter (443 mg per deciliter), a white-cell count of less than 3000 per cubic millimeter, a platelet count of less than 100,000 per cubic millimeter, or infection with hepatitis B or C virus or with the human immunodeficiency virus.
Trial Design
From March 2006 through March 2010, we studied patients in the trial at the University Hospital Zurich in accordance with the ethical principles of the Declaration of Helsinki, the Good Clinical Practice guidelines of the International Conference on Harmonization, and local regulatory requirements. The local medical ethics committee approved the protocol, which was later published.21 All patients provided written informed consent.
The manufacturer of sirolimus, Wyeth Switzerland (now Pfizer), provided the study drug and an unrestricted research grant. The company had no role in the design of the trial or in the collection, analysis, or interpretation of the data or the writing of the manuscript. The authors vouch for the accuracy and completeness of the reported data and the fidelity of this report to the trial protocol and statistical analysis plan, which are available with the full text of this article at NEJM.org.
Data Collection
Each patient's total kidney volume was measured by means of abdominal magnetic resonance imaging (MRI) without the administration of contrast material at enrollment and 6 months later (just before randomization). Patients with a documented increase in total kidney volume of more than 2% during this run-in phase were randomly assigned in a 1:1 ratio to receive either sirolimus (target dose, 2 mg daily) or standard care (control group). Patients with less than a 2% increase in total kidney volume underwent a third measurement of kidney volume after a second 6-month period and underwent randomization if the increase in total kidney volume was more than 2% during the second run-in phase.
Follow-up visits were scheduled at 3, 6, 9, 12, and 18 months after randomization. Sirolimus levels were measured at each follow-up visit, and the dose was adjusted to achieve steady-state levels between 4 and 10 µg per liter. In the sirolimus group, four additional visits were scheduled during the first 6 months for dose adjustment and management of any side effects of sirolimus.
At each visit, measurements of serum creatinine (with the use of a modified Jaffe method traceable to an isotope-dilution mass spectroscopy reference), lipids, liver enzymes, and blood components were performed, along with measurements of albumin and creatinine in spot urine samples. The GFR was estimated with the use of the Chronic Kidney Disease Epidemiology Collaboration equation.22 Steady-state levels of sirolimus in whole blood were determined by means of liquid chromatography–mass spectrometry.
Patients' adherence to the sirolimus regimen was assessed by an electronic system that monitored the date and time of the opening of the medication bottle (MEMS, Aardex). Adverse events were assessed in all randomly assigned patients who underwent at least one follow-up visit and were classified according to the National Cancer Institute's Common Terminology Criteria for Adverse Events, version 3.0.23
Imaging
Transaxial unenhanced MRI was performed with the use of a 1.5-Tesla system (Signa Echospeed Excite HD or HDx, GE Healthcare) and a phased-array surface coil at randomization and at 6, 12, and 18 months. Sequences were acquired with the use of breath-hold T1-weighted fast spoiled gradient echo without fat suppression and respiratory-triggered T2-weighted fast spin echo protocols.24 For measurements of total kidney volume, two independent observers performed manual segmentation of each polycystic kidney on a dedicated computer workstation (Advantage Windows Workstation 4.4, GE Healthcare). Each observer was unaware of all clinical data and the findings of the other observer, and the measurements were performed in random order. At each point in time, right and left kidney volumes were summed for each patient, and the average of the two observers' measurements was used for analysis.
Interim Analysis
After 50% of the patients had completed the first 6 months in the study, the data and safety monitoring board performed a planned interim analysis of the primary outcome. To maintain an overall alpha level of 0.05, the O'Brien–Fleming boundary approach was applied with nominal P values of 0.005 and 0.048 required to show a significant treatment effect in interim and final analyses, respectively.25 The board recommended the continuation of enrollment up to the calculated sample size.26
Statistical Analysis
Data from patients enrolled in the Consortium for Radiologic Imaging Studies of Polycystic Kidney Disease (CRISP) showed an annual increase in the mean (±SD) total kidney volume of 64±70 ml per year (a relative increase of 5.27±3.92%).27 We anticipated recruiting patients with an increased rate of progression, since only patients with documented kidney-volume enlargement were eligible for this trial. We assumed an initial total kidney volume of 1000 cm3 and an annual increase in volume of 6.00±4.75%, which would require a sample of 40 patients in each group to provide a power of 80% to detect a 50% difference in the annual increase with the use of a two-sided alpha level of 0.05. To allow for a dropout rate of up to 20%, we determined that 100 patients should undergo randomization.
The primary efficacy analysis in the protocol (percent increase in total kidney volume since randomization) was amended in an analysis plan prepared in April 2008, since measurement of the percent change did not account for chance imbalance between groups at randomization, and the mean percent change was not necessarily normally distributed (for details, see the Statistical Methods section in the Supplementary Appendix at NEJM.org). An analysis of covariance of the log10 total kidney volume at the end of the trial, with adjustment for the log10 total kidney volume at randomization as a covariate, was used to appropriately adjust for any chance imbalance between groups at randomization and to provide a more precise estimate of the effect of treatment. The least-squares mean difference between the groups on the log10 scale was then back-transformed to provide a sirolimus-to-control ratio. Since the distribution of log10-transformed total kidney volume was approximately normal (Fig. 1 in the Supplementary Appendix), this ratio reflects the multiplicative effect of treatment on the median total kidney volume in the control group. For the four patients with missing values for total kidney volume at 18 months, a conservative nominal value was assigned, assuming an increase from randomization that was equal to either the upper quartile increase in the sirolimus group (two patients) or the lower quartile increase in the control group (two patients). In a planned additional efficacy analysis, the covariates of age, sex, and urinary albumin excretion rate at randomization were added to the analysis-of-covariance model.
Secondary outcomes (GFR and log10-transformed urinary albumin excretion rate) were analyzed in the same manner but with missing values replaced by carrying the last observation forward (in the case of three patients for the GFR and four patients for the urinary albumin excretion rate). SAS software, version 9.1.3, was used for analyses, and R, version 2.10.1, for graphics, with the default locally weighted scatterplot smoothing function in R used to estimate a nonparametric mean response curve for the outcome in each group over time.28
Results
Patients
From March 2006 through March 2008, a total of 265 patients were screened, and 100 patients were recruited and randomly assigned to the sirolimus group (50 patients) or the control group (50 patients) (Figure 1). Of these patients, 82 had an increase in total kidney volume of more than 2% during the first run-in period, and 18 had such enlargement during the second run-in period; 33 patients underwent screening twice. At randomization, the characteristics of the patients were similar in the two groups (Table 1).
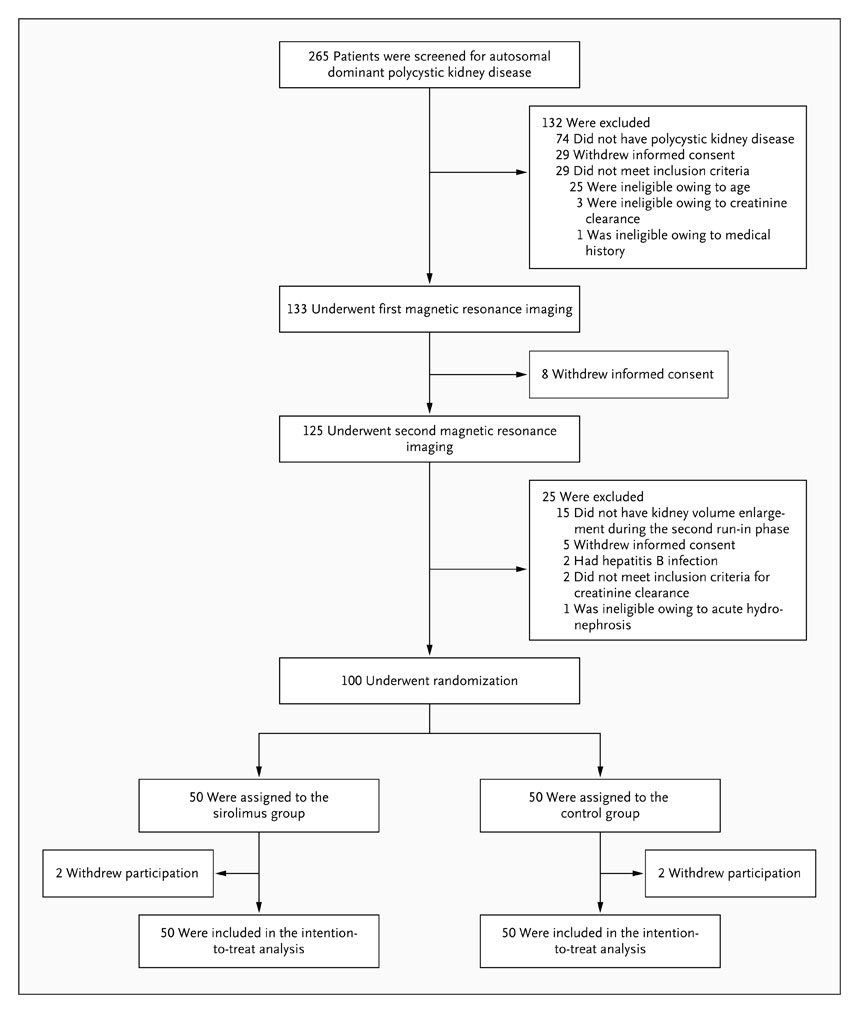
Figure 1. Enrollment and Outcomes.
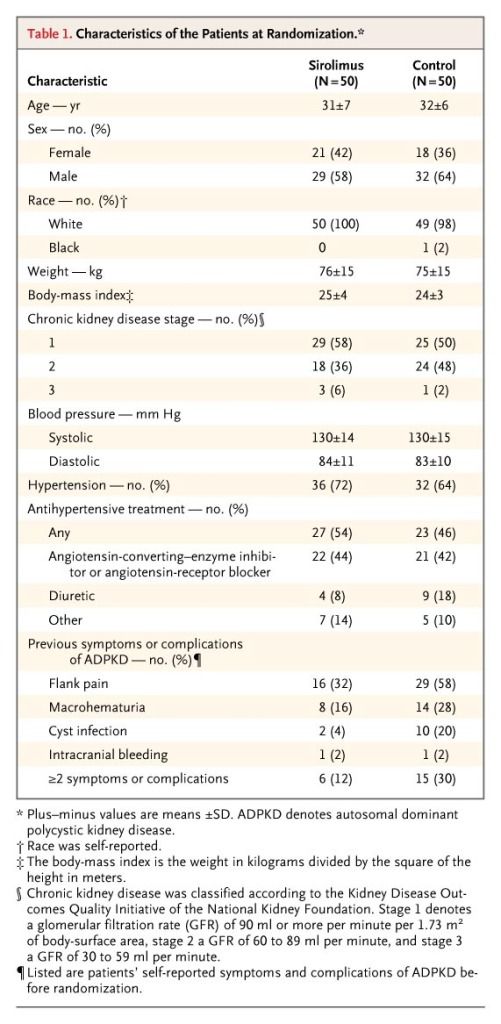
Table 1. Characteristics of the Patients at Randomization.
Patients were in early stages of chronic kidney disease: 94% of those in the sirolimus group and 98% of those in the control group had a GFR of 60 ml or more per minute per 1.73 m2 of body-surface area. The median follow-up time was 19 months (interquartile range, 18 to 20) in the two groups. Four patients (two in eachgroup) withdrew from the study; one of the patients in the sirolimus group withdrew before receiving a first dose of sirolimus and was lost to follow-up. All 100 randomized patients were included in the intention-to-treat analysis, as specified in the protocol.
Total Kidney Volume
At randomization, the median total kidney volume was 907 cm3 (interquartile range, 577 to 1330) in the sirolimus group and 1003 cm3 (interquartile range, 574 to 1422) in the control group (Table 2). During the 18-month study period, the median total kidney volume increased by 99 cm3 (interquartile range, 43 to 173) in the sirolimus group and 97 cm3 (interquartile range, 37 to 181) in the control group. At 18 months, the median total kidney volume in the sirolimus group was 102% of that in the control group (95% confidence interval [CI], 99 to 105; P=0.26). The ratio of total kidney volume in the sirolimus group to total volume in the control group remained constant throughout the trial (Figure 2). Annual rates of growth in total kidney volume were 9.7% in the sirolimus group and 9.5% in the control groupbetween enrollment and randomization and 7.8% in the sirolimus group and 6.8% in the control group between randomization and 18 months.
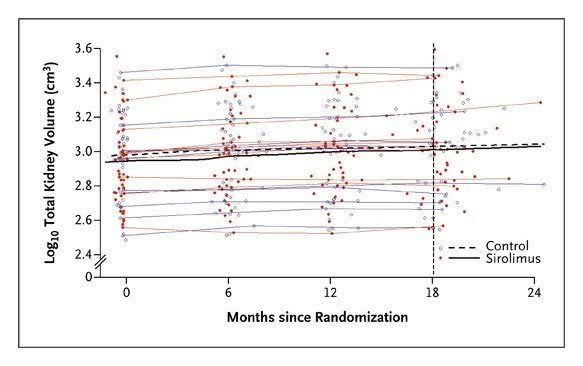
Figure 2. Total Kidney Volume.
The black curves in the center of the plot show nonparametric mean response curves for the sirolimus group and the control group, calculated with the use of the default locally weighted scatterplot smoothing function in R, version 2.10.1. The red and blue curves show measurements from a random sample of 10 patients in each study group. The vertical line indicates the planned duration of the trial.
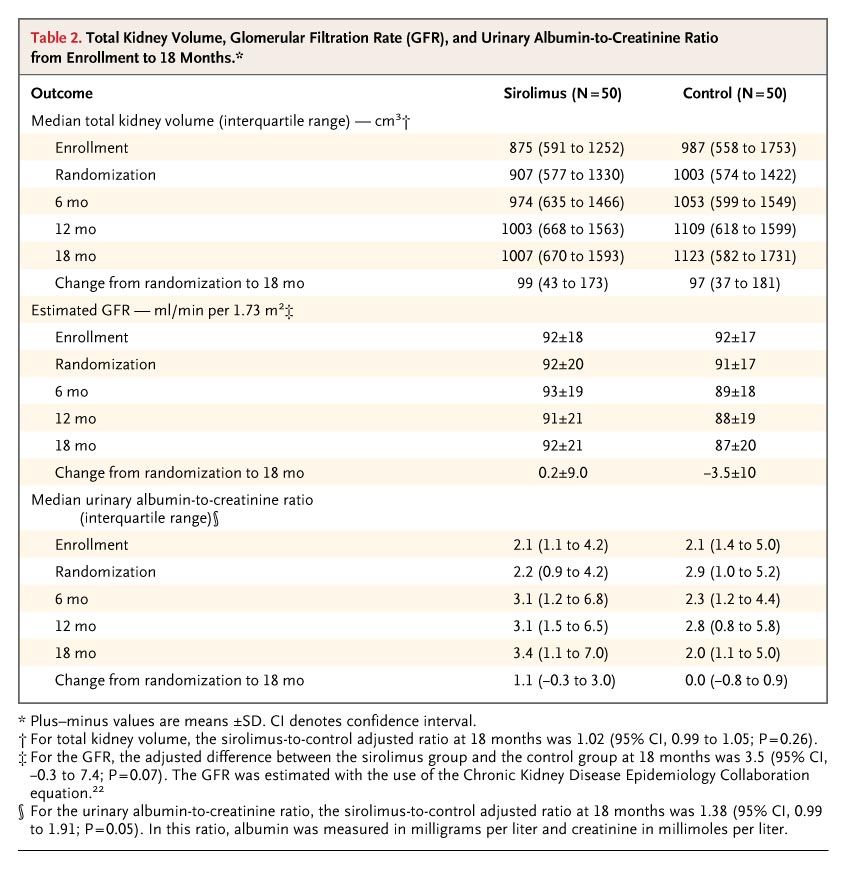
Table 2. Total Kidney Volume, Glomerular Filtration Rate (GFR), and Urinary Albumin-to-Creatinine Ratio from Enrollment to 18 Months.
stimates of the sirolimus-to-control ratio for kidney volume at 18 months were almost identical in the per-protocol analysis, as well as in one planned and one unplanned additional analyses of total kidney volume (Table 1 in the Supplementary Appendix). In the planned additional analysis, there was no significant between-group difference in total kidney volume according to age, sex, or albumin-to-creatinine ratio at randomization. At randomization, 43 patients were receiving an angiotensin-converting–enzyme (ACE) inhibitor or an angiotensin-receptor blocker (ARB) (22 in the sirolimus group and 21 in the control group), and most of these patients continued using the drugs. In the unplanned additional analysis, there was no significant between-group difference in total kidney volume among patients who were taking either an ACE inhibitor or an ARB, nor was there any evidence that the sirolimus-to-control ratio for kidney volume differed if patients were treated with these drugs.
At randomization, the median total cyst volume was 559 cm3 (interquartile range, 240 to 902) in the sirolimus group and 551 cm3 (interquartile range, 263 to 959) in the control group. Over the 18-month treatment period, the total cyst volume increased by a median of 74 cm3 (interquartile range, 3 to 168) in the sirolimus group and 59 cm3 (interquartile range, 21 to 142) in the control group. The increase in the median total noncystic kidney volume from randomization to 18 months was similar in the two groups: 23 cm3 (interquartile range, –18 to 89) in the sirolimus group and 27 cm3 (interquartile range, –9 to 93) in the control group.
Estimated GFR and Albuminuria
At 18 months, the adjusted between-group difference in estimated GFR was 3.5 ml per minute per 1.73 m2 (95% CI, –0.3 to 7.4; P=0.07). The difference between the two groups remained constant throughout the trial (Fig. 2 in the Supplementary Appendix). However, at 18 months, the median ratio of urinary albumin tocreatinine in the sirolimus group was 138% of that in the control group (95% CI, 99 to 191; P=0.05). The ratio between the two groups increased steadily during the trial (Fig. 3 in the Supplementary Appendix).
Sirolimus Dose, Steady-State Drug Levels, and Adherence
After the initial dose-adjustment phase, the mean sirolimus dose and sirolimus steady-state blood levels remained stable throughout the trial (Table 2 in theSupplementary Appendix). The mean adherence to the sirolimus regimen, which was measured as a percentage of the correct dose, was 97% for the entire treatment period (Fig. 4 in the Supplementary Appendix).
Blood Pressure and Antihypertensive Therapy
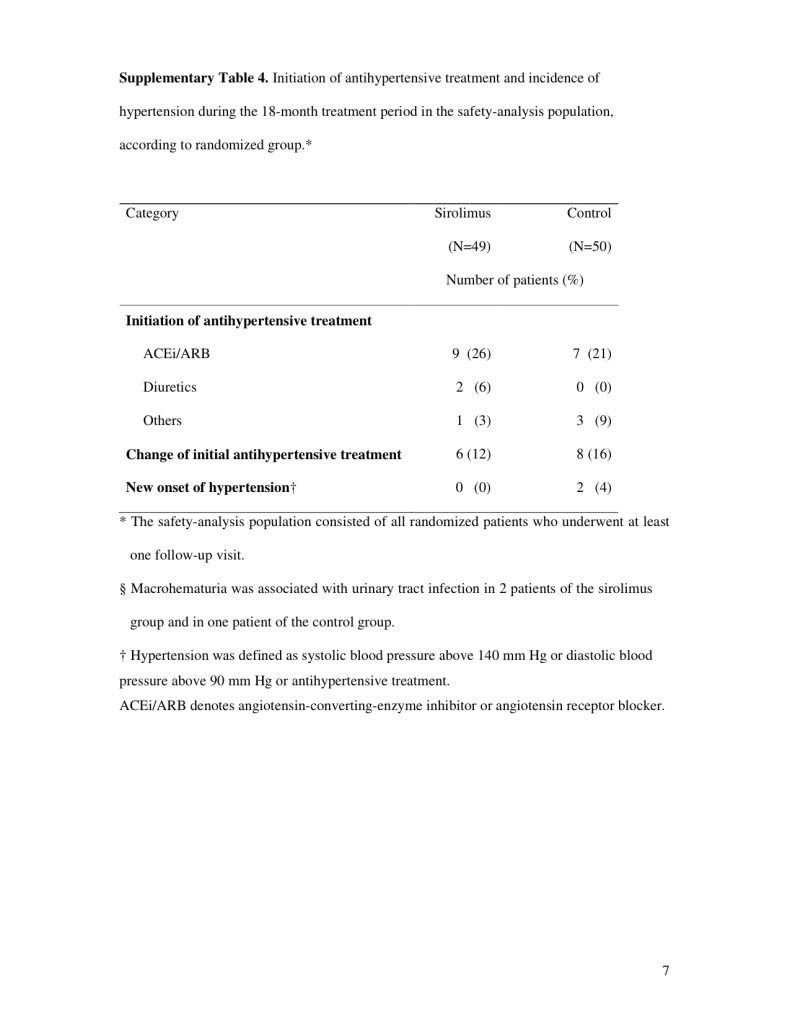
After randomization, the mean systolic and diastolic blood pressures remained stable in both groups (Table 3 in the Supplementary Appendix). The numbers of patients with hypertension who initiated antihypertensive treatment were similar in the two groups, with ACE inhibitors and ARBs being the most common form of treatment (Table 4 in the Supplementary Appendix).
Adverse Events
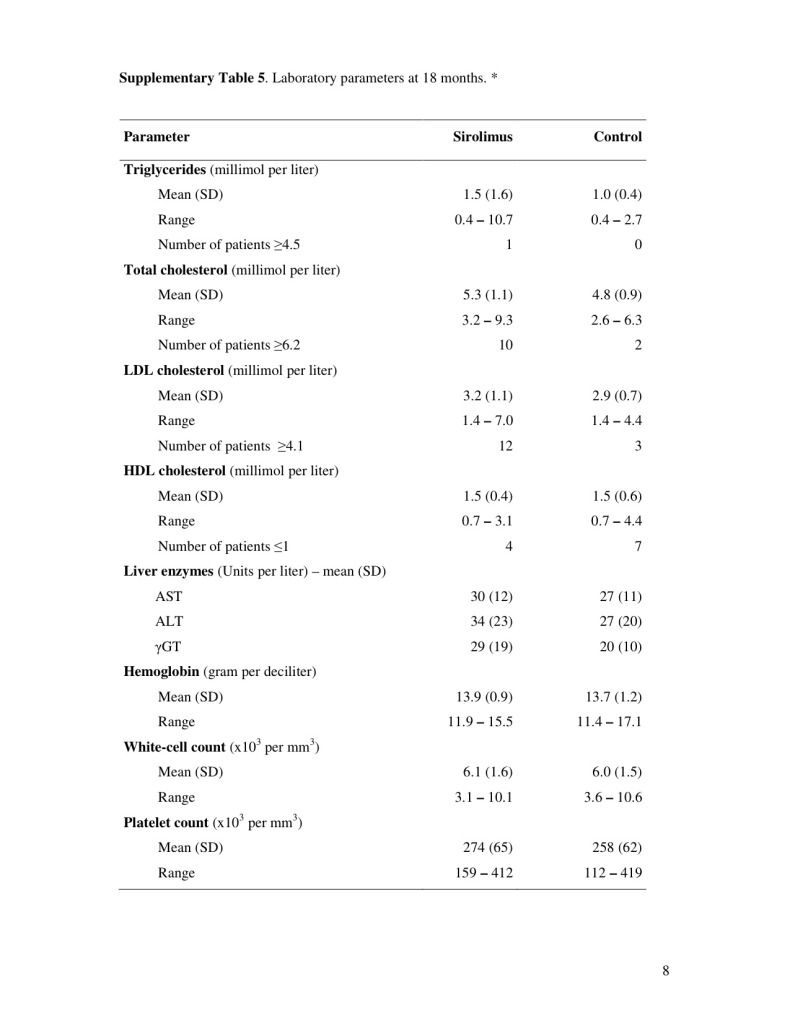
The overall incidence of adverse events and of serious adverse events was similar in the two groups (Table 3). The total number of patients with gastrointestinal adverse events was higher in the sirolimus group (94%) than in the control group (52%). The most common gastrointestinal adverse events were oral mucositis (in 82% of patients in the sirolimus group and 14% of those in the control group) and diarrhea (61% and 30% of patients, respectively). Peripheral edema occurred in 16% of patients in the sirolimus group but in none of those in the control group. One patient in the sirolimus group withdrew at 9 months because of fatigue. At 18 months, triglyceride and cholesterol levels were higher among patients in the sirolimus group (Table 5 in the Supplementary Appendix).
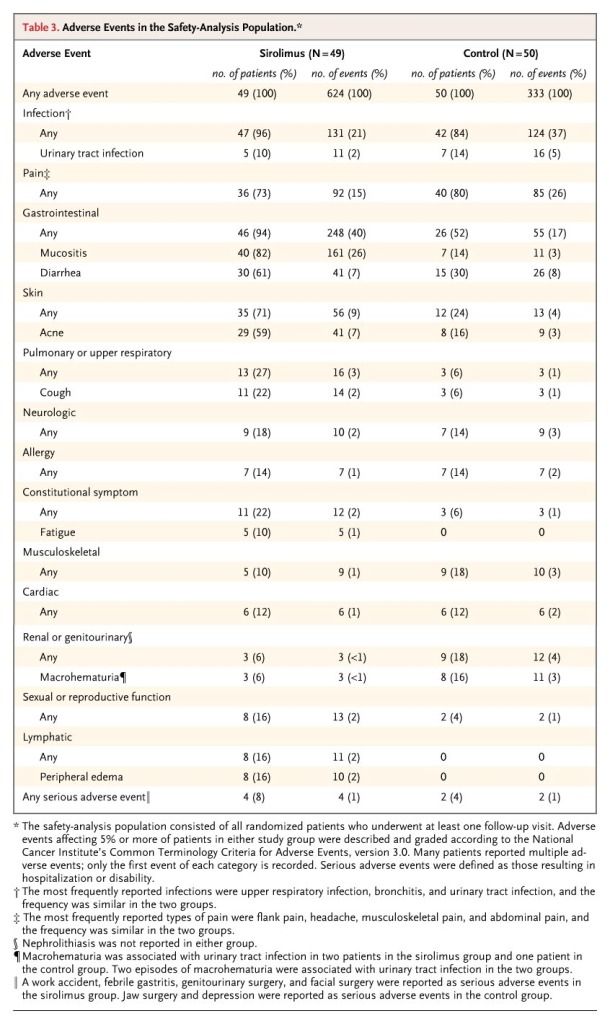
Table 3. Adverse Events in the Safety-Analysis Population.
Discussion
In this study, we aimed to determine whether treatment with sirolimus would slow kidney growth in patients with ADPKD who had progressive disease. We found no significant difference in total kidney volume after 18 months of treatment with sirolimus, regardless of the patient's age, sex, or albumin:creatinine ratio at randomization or whether they were receiving therapy with an ACE inhibitor or an ARB. Our estimate of the ratio of kidney volume in the sirolimus group to that in the control group rules out any clinically meaningful reduction in total kidney volume with the use of sirolimus. On the basis of the lower boundary of the 95% confidence interval for this ratio, 18 months of treatment with sirolimus would at best reduce a median total kidney volume of 1100 cm3 by 11 cm3.
The magnitude of kidney-volume expansion in patients with ADPKD is thought to be the best predictor of the subsequent decline in GFR.27 The discrepancy between the steady increase in cyst volume and the delayed decline in renal function is an intrinsic difficulty in efforts to assess the effect of a treatment on ADPKD. Assessing treatment through its effect on the GFR would require either trials involving patients with advanced disease or a considerable period of follow-up. Measurement of the increase in kidney or cyst volume is the most practical surrogate test of the effect of a treatment at an early stage of the disease.
Our trial was not designed to assess the effect of sirolimus on the GFR. As expected, the GFR declined only slightly in the control group, but it remained stable in the sirolimus group, most likely reflecting a sirolimus-associated change in glomerular hemodynamics.29 Albuminuria is an established predictor of disease progression, and approximately 40% of our patients had microalbuminuria at randomization. There was a slight increase in albuminuria in the sirolimus group, also presumably reflecting a known side effect of the drug.30
The results of this trial contrast with preclinical data, which showed significant benefits of mTOR inhibition in rodent models of polycystic kidney disease.9,10,11,12,13,16 Studies in rodent models of ADPKD, including an orthologous mouse model of human ADPKD, have shown that mTOR inhibition effectively reduces disease progression. However, the mTOR inhibitors were primarily used in rodent models of early-onset or rapidly progressive disease at early stages of cyst development. These models may not appropriately reflect the more complex and heterogeneous pathogenesis of ADPKD in humans, in whom the disease progresses slowly over several decades and the mechanism of cyst growth is not yet understood.31 Our results have to be interpreted in the context of the trial setting, and it is possible that sirolimus treatment in adolescence, for a longer period, or in combination with other therapies could delay the progression of ADPKD.
It is possible that sirolimus had no effect because of a suboptimal dose. The achieved sirolimus dose was approximately 25% lower than the intended dose of 2 mg per day, mainly because of dose-limiting side effects. Higher doses of sirolimus increase the frequency of side effects,32 and it is likely that adherence to treatmentwould suffer. The measurement of adherence with the use of electronic devices showed that patients in the sirolimus group took 97% of the intended dose throughout the trial, making nonadherence an unlikely explanation for the negative results.
In conclusion, in a randomized, controlled trial of an 18-month course of oral sirolimus for adults with ADPKD and early chronic kidney disease, we found no evidence that sirolimus slowed polycystic kidney growth. Our results suggest that oral sirolimus as used in this trial is not effective in patients with ADPKD at an early stage of the disease.
Supported by a grant from the Swiss National Science Foundation (310000-118166), by the Polycystic Kidney Foundation, by an unrestricted research grant from Wyeth (now Pfizer), and by the Binelli and Ehrsam Foundation. Wyeth Switzerland (now Pfizer) provided the sirolimus, and GE Healthcare Switzerland provided an Advantage Workstation for volumetric analysis of MRI data.
Dr. Serra reports receiving consulting fees from Hoffmann–La Roche and Nycomed, lecture fees from Genzyme, and travel grants from Wyeth and Amgen; Dr. Poster, travel support from Wyeth; Dr. Kistler, lecture fees from Wyeth; Dr. Young, being an employee of Biometrical Practice BIOP; Dr. Kristanto, being an employee of Aardex; Dr. Weishaupt, receiving lecture fees from Bayer Schering Pharma and consulting fees from General Electric Healthcare and grant support from Bayer Schering paid to his institution, University Hospital Zurich; and Dr. Wüthrich, receiving consulting and lecture fees and travel support from Genzyme, Novartis, and Wyeth. No other potential conflict of interest relevant to this article was reported.
Disclosure forms provided by the authors are available with the full text of this article at NEJM.org.
We thank Marian Struker, Ruth Russi, Adrian Wüthrich, and Christina Zbinden for their technical support; Janine Suter for trial monitoring (Kammermann Monitoring Services, Zug); Dr. Michael Pickering of Biometrical Practice BIOP, Basel, for his independent data analysis; Drs. Natascia Corti, Gérald Keusch, Lukas Zimmerli, and Oliver Senn (chair) for their work as members of the data and safety monitoring board; Dr. Matthew H. Liang for his helpful advice; and the referring nephrologists in Switzerland for their support in making this trial possible.
Source Information
From the Division of Nephrology (A.L.S., D.P., A.D.K., F.K., S.R., R.P.W.), Institute of Clinical Chemistry (K.M.R., K.S.S.), Institute of General Practice and Health Services Research (O.S.), and Division of Diagnostic and Interventional Radiology (H.S., D.W.), University Hospital and the University of Zurich, Zurich; and Biometrical Practice BIOP, Basel (J.Y.) — all in Switzerland; and the Pharmionic Research Center, Visé, Belgium (P.K.).
This article (10.1056/NEJMoa0907419) was published on June 26, 2010, at NEJM.org.
Address reprint requests to Dr. Wüthrich at the Division of Nephrology, University Hospital, Rämistr. 100, Zurich 8091, Switzerland, or at rudolf.wuethrich@usz.ch.
References
- Dalgaard OZ. Bilateral polycystic disease of the kidneys: a follow-up of two hundred and eighty-four patients and their families. Acta Med Scand Suppl 1957;328:1-255. [Medline]
- Stengel B, Billon S, Van Dijk PC, et al. Trends in the incidence of renal replacement therapy for end-stage renal disease in Europe, 1990-1999. Nephrol Dial Transplant 2003;18:1824-1833. [Free Full Text]
- Torres VE, Harris PC, Pirson Y. Autosomal dominant polycystic kidney disease. Lancet 2007;369:1287-1301. [CrossRef][Web of Science][Medline]
- Chapman AB, Guay-Woodford LM, Grantham JJ, et al. Renal structure in early autosomal-dominant polycystic kidney disease (ADPKD): the Consortium for Radiologic Imaging Studies of Polycystic Kidney Disease (CRISP) cohort. Kidney Int 2003;64:1035-1045. [CrossRef][Web of Science][Medline]
- Klahr S, Breyer JA, Beck GJ, et al. Dietary protein restriction, blood pressure control, and the progression of polycystic kidney disease. J Am Soc Nephrol 1995;5:2037-2047. [Abstract]
- Schrier RW. Optimal care of autosomal dominant polycystic kidney disease patients. Nephrology (Carlton) 2006;11:124-130. [CrossRef][Medline]
- Torres VE, Harris PC. Autosomal dominant and recessive polycystic kidney diseases. Nat Clin Pract Nephrol 2006;2:40-55. [CrossRef][Web of Science][Medline]
- Harris PC, Torres VE. Polycystic kidney disease. Annu Rev Med 2009;60:321-337. [CrossRef][Web of Science][Medline]
- Shillingford JM, Murcia NS, Larson CH, et al. The mTOR pathway is regulated by polycystin-1, and its inhibition reverses renal cystogenesis in polycystic kidney disease. Proc Natl Acad Sci U S A 2006;103:5466-5471. [Free Full Text]
- Shillingford JM, Piontek KB, Germino GG, Weimbs T. Rapamycin ameliorates PKD resulting from conditional inactivation of Pkd1. J Am Soc Nephrol 2010;21:489-497. [Free Full Text]
- Tao Y, Kim J, Schrier RW, Edelstein CL. Rapamycin markedly slows disease progression in a rat model of polycystic kidney disease. J Am Soc Nephrol 2005;16:46-51. [Free Full Text]
- Wahl PR, Serra AL, Le Hir M, Molle KD, Hall MN, Wüthrich RP. Inhibition of mTOR with sirolimus slows disease progression in Han:SPRD rats with autosomal dominant polycystic kidney disease (ADPKD). Nephrol Dial Transplant 2006;21:598-604. [Free Full Text]
- Zafar I, Belibi FA, He Z, Edelstein CL. Long-term rapamycin therapy in the Han:SPRD rat model of polycystic kidney disease (PKD). Nephrol Dial Transplant 2009;24:2349-2353. [Free Full Text]
- Reichardt W, Romaker D, Becker A, Buechert M, Walz G, von Elverfeldt D. Monitoring kidney and renal cyst volumes applying MR approaches on a rapamycin treated mouse model of ADPKD. MAGMA 2009;22:143-149. [CrossRef][Medline]
- Spirli C, Okolicsanyi S, Fiorotto R, et al. Mammalian target of rapamycin regulates vascular endothelial growth factor-dependent liver cyst growth in polycystin-2-defective mice. Hepatology 2010;51:1778-1788. [Web of Science][Medline]
- Wu M, Wahl PR, Le Hir M, Waeckerle-Men Y, Wüthrich RP, Serra AL. Everolimus retards cyst growth and preserves kidney function in a rodent model for polycystic kidney disease. Kidney Blood Press Res 2007;30:253-259. [CrossRef][Web of Science][Medline]
- Wu M, Arcaro A, Varga Z, et al. Pulse mTOR inhibitor treatment effectively controls cyst growth but leads to severe parenchymal and glomerular hypertrophy in rat polycystic kidney disease. Am J Physiol Renal Physiol 2009;297:F1597-F1605. [Free Full Text]
- Berthier CC, Wahl PR, Le Hir M, et al. Sirolimus ameliorates the enhanced expression of metalloproteinases in a rat model of autosomal dominant polycystic kidney disease. Nephrol Dial Transplant 2008;23:880-889. [Free Full Text]
- Ravine D, Gibson RN, Walker RG, Sheffield LJ, Kincaid-Smith P, Danks DM. Evaluation of ultrasonographic diagnostic criteria for autosomal dominant polycystic kidney disease. Lancet 1994;343:824-827. [CrossRef][Web of Science][Medline]
- Cockcroft DW, Gault MH. Prediction of creatinine clearance from serum creatinine. Nephron 1976;16:31-41. [Web of Science][Medline]
- Serra AL, Kistler AD, Poster D, et al. Clinical proof-of-concept trial to assess the therapeutic effect of sirolimus in patients with autosomal dominant polycystic kidney disease: SUISSE ADPKD study. BMC Nephrol 2007;8:13-13. [CrossRef][Medline]
- Levey AS, Stevens LA, Schmid CH, et al. A new equation to estimate glomerular filtration rate. Ann Intern Med 2009;150:604-612. [Free Full Text]
- Trotti A, Colevas AD, Setser A, et al. CTCAE v3.0: development of a comprehensive grading system for the adverse effects of cancer treatment. Semin Radiat Oncol 2003;13:176-181. [CrossRef][Web of Science][Medline]
- Kistler AD, Poster D, Krauer F, et al. Increases in kidney volume in autosomal dominant polycystic kidney disease can be detected within 6 months. Kidney Int 2009;75:235-241. [CrossRef][Web of Science][Medline]
- Wang SK, Tsiatis AA. Approximately optimal one-parameter boundaries for group sequential trials. Biometrics 1987;43:193-199. [CrossRef][Web of Science][Medline]
- Serra AL, Kistler AD, Poster D, et al. Safety and tolerability of sirolimus treatment in patients with autosomal dominant polycystic kidney disease. Nephrol Dial Transplant 2009;24:3334-3342. [Free Full Text]
- Grantham JJ, Torres VE, Chapman AB, et al. Volume progression in polycystic kidney disease. N Engl J Med 2006;354:2122-2130. [Free Full Text]
- Fitting smooth curves to longitudinal data. In: Diggle P, Liang K, Zeger S. Analysis of longitudinal data. Oxford, England: Clarendon Press, 1995:41-5.
- Golbaekdal K, Nielsen CB, Djurhuus JC, Pedersen EB. Effects of rapamycin on renal hemodynamics, water and sodium excretion, and plasma levels of angiotensin II, aldosterone, atrial natriuretic peptide, and vasopressin in pigs. Transplantation 1994;58:1153-1157. [Web of Science][Medline]
- Chapman JR, Rangan GK. Why do patients develop proteinuria with sirolimus? Do we have the answer? Am J Kidney Dis 2010;55:213-216. [CrossRef][Web of Science][Medline]
- Grantham JJ, Cook LT, Wetzel LH, Cadnapaphornchai MA, Bae KT. Evidence of extraordinary growth in the progressive enlargement of renal cysts. Clin J Am Soc Nephrol 2010;5:889-896. [Free Full Text]
- Perico N, Antiga L, Caroli A, et al. Sirolimus therapy to halt the progression of ADPKD. J Am Soc Nephrol 2010;21:1031-1040. [Free Full Text]


 留言列表
留言列表
 線上藥物查詢