Nature (2017) doi:10.1038/nature21706
Platelets are critical for haemostasis, thrombosis, and inflammatory responses1, 2, but the events that lead to mature platelet production remain incompletely understood3. The bone marrow has been proposed to be a major site of platelet production, although there is indirect evidence that the lungs might also contribute to platelet biogenesis4, 5, 6, 7. Here, by directly imaging the lung microcirculation in mice8, we show that a large number of megakaryocytes circulate through the lungs, where they dynamically release platelets. Megakaryocytes that release platelets in the lungs originate from extrapulmonary sites such as the bone marrow; we observed large megakaryocytes migrating out of the bone marrow space. The contribution of the lungs to platelet biogenesis is substantial, accounting for approximately 50% of total platelet production or 10 million platelets per hour. Furthermore, we identified populations of mature and immature megakaryocytes along with haematopoietic progenitors in the extravascular spaces of the lungs. Under conditions of thrombocytopenia and relative stem cell deficiency in the bone marrow9, these progenitors can migrate out of the lungs, repopulate the bone marrow, completely reconstitute blood platelet counts, and contribute to multiple haematopoietic lineages. These results identify the lungs as a primary site of terminal platelet production and an organ with considerable haematopoietic potential.
Main
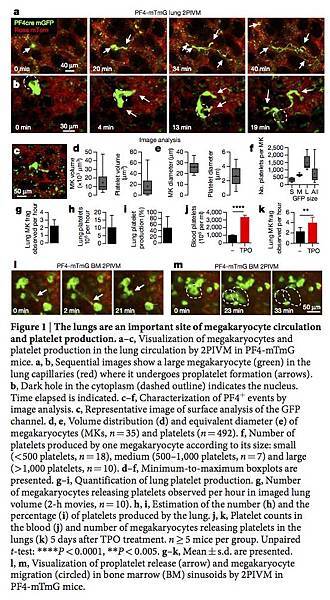
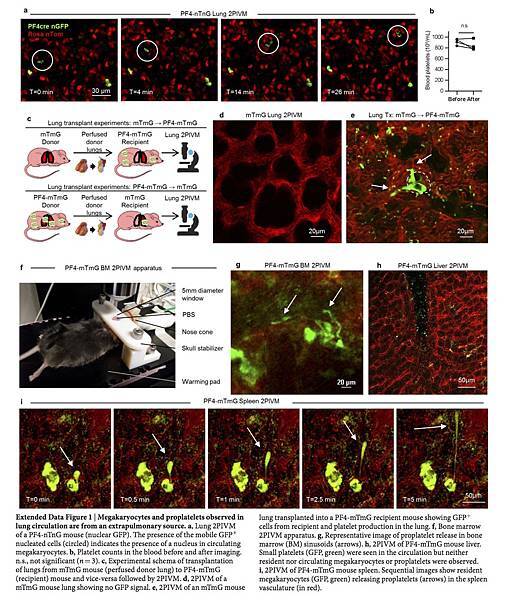
Platelets are released from megakaryocytes; however, even though they were discovered in the nineteenth century, we do not completely understand the mechanisms by which platelets are produced. On the basis of previous work showing the presence of megakaryocytes in the lungs10 and demonstrating that blood leaving the lungs contains more platelets and fewer megakaryocytes than blood entering the lungs4, 11, we hypothesized that the lungs could have a major role in platelet biogenesis, and directly investigated this process using 2-photon intravital microscopy (2PIVM) of the lungs and fluorescent reporter mouse strains. We used PF4-Cre × Gt(ROSA)26Sortm4(ACTB-tdTomato,-EGFP)Luo (mTmG) (hereafter called PF4-mTmG) reporter mice, in which PF4-Cre12 drives membrane GFP expression in megakaryocytes and platelets, while all other cells are labelled with membrane tomato. We observed large circulating GFP+ cells that passed through the lung microcirculation, where they produced GFP+ extensions in a flow-dependent manner (Fig. 1a, b and Supplementary Video 1). These events resembled proplatelet and preplatelet formation from cultured megakaryocytes3, 13, 14. In the lungs, the duration of these events varied from approximately 20 to 60 min (Fig. 1a, b and Supplementary Video 1). Many of the GFP+ cells contained large nuclei (more than 10 μm), which appeared as unlabelled dark holes that remained intact during this process (Fig. 1b and Supplementary Video 2) and resulted in naked intravascular nuclei after platelets were released (Supplementary Video 2). We confirmed that we labelled large mobile nucleated cells by imaging the lung microcirculation of PF4-Cre × Gt(ROSA)26Sortm1(CAG-tdTomato*,-EGFP*)Ees (nTnG) (hereafter called PF4-nTnG) reporter mice, in which a fluorescence switch allows GFP+ nuclei to be tracked (Extended Data Fig. 1a and Supplementary Video 3).
Figure 1: The lungs are an important site of megakaryocyte circulation and platelet production.
a–c, Visualization of megakaryocytes and platelet production in the lung circulation by 2PIVM in PF4-mTmG mice. a, b, Sequential images show a large megakaryocyte (green) in the lung capillaries (red) where it undergoes proplatelet formation (arrows). b, Dark hole in the cytoplasm (dashed outline) indicates the nucleus. Time elapsed is indicated. c–f, Characterization of PF4+ events by image analysis. c, Representative image of surface analysis of the GFP channel. d, e, Volume distribution (d) and equivalent diameter (e) of megakaryocytes (MKs, n = 35) and platelets (n = 492). f, Number of platelets produced by one megakaryocyte according to its size: small (<500 platelets, n = 18), medium (500–1,000 platelets, n = 7) and large (>1,000 platelets, n = 10). d–f, Minimum-to-maximum boxplots are presented. g–i, Quantification of lung platelet production. g, Number of megakaryocytes releasing platelets observed per hour in imaged lung volume (2-h movies, n = 10). h, i, Estimation of the number (h) and the percentage (i) of platelets produced by the lung. j, k, Platelet counts in the blood (j) and number of megakaryocytes releasing platelets in the lungs (k) 5 days after TPO treatment. n ≥ 5 mice per group. Unpaired t-test: ****P < 0.0001, **P < 0.005. g–k, Mean ± s.d. are presented. l, m, Visualization of proplatelet release (arrow) and megakaryocyte migration (circled) in bone marrow (BM) sinusoids by 2PIVM in PF4-mTmG mice.
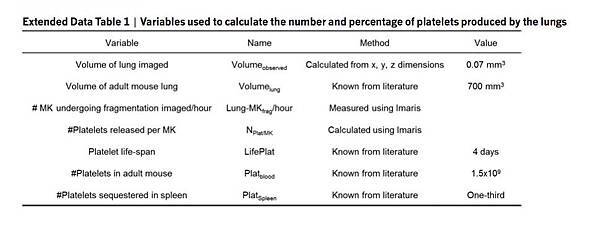
We next quantified the GFP+ megakaryocytes and proplatelets in PF4-mTmG lungs by assigning surface volumes (Fig. 1c and Supplementary Video 4). The putative megakaryocytes (large GFP+ cells undergoing platelet release) had median volumes of 10,000 μm3 and diameters of more than 25 μm (Fig. 1d, e), whereas the putative platelets (small circulating GFP+ events) had median volumes of below 10 μm3 and diameters of 2–3 μm (Fig. 1d, e). These values are consistent with previous estimates of megakaryocytes and platelet sizes3. For each large GFP+ cell undergoing platelet release, we calculated the number of platelets that could be liberated into the lung circulation, and this ranged from fewer than 500 platelets for small megakaryocytes or proplatelets to more than 1,000 platelets for larger megakaryocytes (Fig. 1f), with a median of around 500 platelets per megakaryocyte. Previous studies have produced widely varying estimates of the number of platelets produced from a single megakaryocyte (200–10,000 platelets)15, 16, 17. Our method uses direct measurement for each event, and therefore is likely to yield more accurate estimates. In total, we analysed 20 h of footage from 10 mice, and observed an average of 2.2 ± 0.26 (n = 10) megakaryocytes per hour in an imaged lung volume of 0.07 mm3 (Fig. 1g and Supplementary Video 5). When extrapolated to the entire lung volume, this equals more than 10 million platelets produced per hour from the lungs (Fig. 1h, Methods and Extended Data Table 1). Overall, when adjusted for platelet lifespan and splenic sequestration, we estimate that the lung is responsible for approximately 50% of total platelet production in the mouse (Fig. 1i, Methods and Extended Data Table 1). Blood platelet counts were unchanged after 2PIVM (Extended Data Fig. 1b). Platelet production by the lungs is also biologically tunable, as the administration of the megakaryocyte growth factor thrombopoietin (TPO) increased blood platelets threefold (Fig. 1j) and the number of megakaryocytes undergoing proplatelet formation observed per hour twofold (3.9 ± 0.38, n = 9) (Fig. 1k). We conclude from these experiments that the lungs are a primary site of platelet biogenesis.
To investigate the origin of the intravascular megakaryocytes and proplatelets in the lungs, we adoptively transferred lung resident cells using the orthotopic single-lung transplant model in mice18. We transplanted a lung from an mTmG mouse (with no Cre or GFP expression) into a PF4-mTmG recipient mouse and vice versa (Extended Data Fig. 1c–e and Supplementary Video 6). Using 2PIVM, we observed proplatelet formation from GFP+ megakaryocytes in the lung vasculature following transplantation of mTmG lungs to PF4-mTmG mice, but not following the reverse transplant (PF4-mTmG lungs to mTmG mice). These experiments confirmed that megakaryocytes releasing platelets in the lung circulation originate from outside the lungs. We hypothesized that the bone marrow19, spleen, or liver could be the source of these intravascular megakaryocytes and proplatelets. We imaged the calvarial bone marrow (Extended Data Fig. 1f) and the spleen in PF4-mTmG mice and observed extravascular megakaryocytes releasing proplatelets into the sinusoids of the bone marrow (Fig. 1l, Extended Data Fig. 1g and Supplementary Video 7) and spleen (Extended Data Fig. 1i and Supplementary Video 9). We also observed large megakaryocytes exiting the bone marrow space (Fig. 1m and Supplementary Video 8). In contrast to observations in the lung, we did not observe any intravascular megakaryocytes undergoing proplatelet formation. We did not observe any megakaryocytes in the liver (Extended Data Fig. 1h).
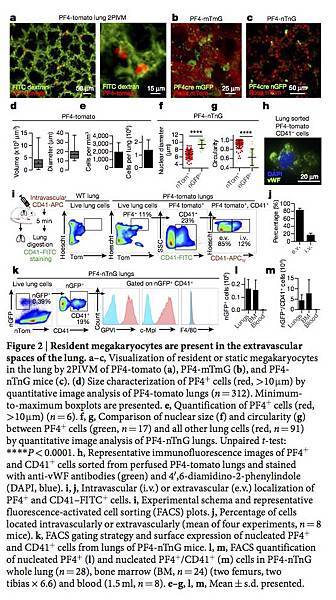
In addition to intravascular megakaryocytes, we also observed large cells in the perivascular lung interstitium in PF4-Cre × Gt(ROSA)26Sortm9(CAG-tdTomato)Hze (ROSA26-tdTomato) (hereafter called PF4-tomato) and PF4-mTmG mice (Fig. 2a, b, Extended Data Fig. 2a and Supplementary Video 10), and in mTmG mice that had received PF4-mTmG lung transplants (Extended Data Fig. 2b). These extravascular cells were sessile during our imaging (up to 4 h) and contained large nuclei (Fig. 2c). Although they were comparatively large, these extravascular cells were on average one-third of the volume and approximately half of the diameter of intravascular megakaryocytes (Fig. 2d) and also smaller than resident megakaryocytes in the bone marrow and spleen (Extended Data Fig. 2c–e). Using image analysis, we detected around 2,000 PF4-tomato cells per cubic millimetre of lung tissue or more than 1 million cells per lung (Fig. 2e). The nuclear diameters of these cells were significantly larger than those of non-GFP+ cells (Fig. 2f) and the nuclei had more complex shapes (Fig. 2g). We used a method of intravascular labelling before lung digestion20 to determine the relative proportions of intravascular and extravascular megakaryocytes (Fig. 2i) and found that 85% of PF4-tomato events were extravascular and 15% intravascular (Fig. 2j).
Figure 2: Resident megakaryocytes are present in the extravascular spaces of the lung.
a–c, Visualization of resident or static megakaryocytes in the lung by 2PIVM of PF4-tomato (a), PF4-mTmG (b), and PF4-nTnG mice (c). (d) Size characterization of PF4+ cells (red, >10 μm) by quantitative image analysis of PF4-tomato lungs (n = 312). Minimum-to-maximum boxplots are presented. e, Quantification of PF4+ cells (red, >10 μm) (n = 6). f, g, Comparison of nuclear size (f) and circularity (g) between PF4+ cells (green, n = 17) and all other lung cells (red, n = 91) by quantitative image analysis of PF4-nTnG lungs. Unpaired t-test: ****P < 0.0001. h, Representative immunofluorescence images of PF4+ and CD41+ cells sorted from perfused PF4-tomato lungs and stained with anti-vWF antibodies (green) and 4′,6-diamidino-2-phenylindole (DAPI, blue). i, j, Intravascular (i.v.) or extravascular (e.v.) localization of PF4+ and CD41–FITC+ cells. i, Experimental schema and representative fluorescence-activated cell sorting (FACS) plots. j, Percentage of cells located intravascularly or extravascularly (mean of four experiments, n = 8 mice). k, FACS gating strategy and surface expression of nucleated PF4+ and CD41+ cells from lungs of PF4-nTnG mice. l, m, FACS quantification of nucleated PF4+ (l) and nucleated PF4+/CD41+ (m) cells in PF4-nTnG whole lung (n = 28), bone marrow (BM, n = 24) (two femurs, two tibias × 6.6) and blood (1.5 ml, n = 8). e–g, l, m, Mean ± s.d. presented.
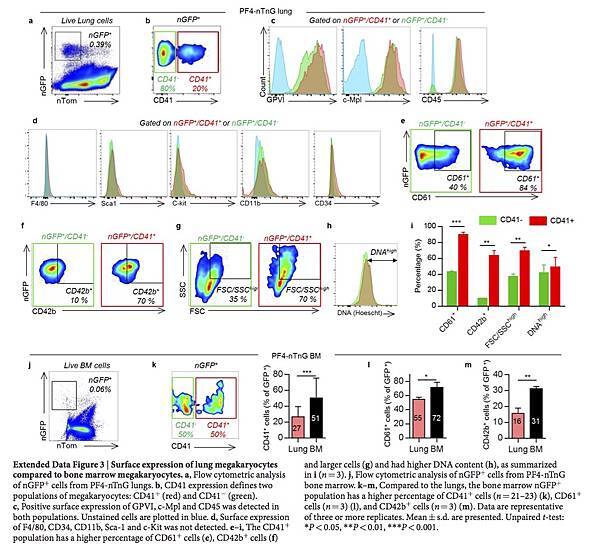
To further characterize lung megakaryocytes, we sorted PF4-tomato+ and CD41+ cells from perfused and digested lungs and stained them with the megakaryocyte and platelet marker von Willebrand factor (vWF). The large, PF4-tomato+ CD41+ cells with complex nuclei also stained positive for vWF in a granular pattern, which is consistent with megakaryocytes (Fig. 2h). To avoid cell aggregation with PF4-tomato+ platelets during flow cytometry staining, we prepared digested lungs from PF4-nTnG mice, in which GFP is targeted to the cell nucleus and thus does not stain anucleate platelets. We gated on nGFP+ CD41+ events as the putative lung megakaryocyte pool (Fig. 2k and Extended Data Fig. 3a) and this population stained for the megakaryocyte and platelet-specific markers glycoprotein VI (GP VI) and the TPO receptor c-Mpl (Fig. 2k), but did not stain for markers of other lung resident cells, such as F4/80 for macrophages (Fig. 2k and Extended Data Fig. 3a–d) confirming that these lung-derived cells were megakaryocytes.
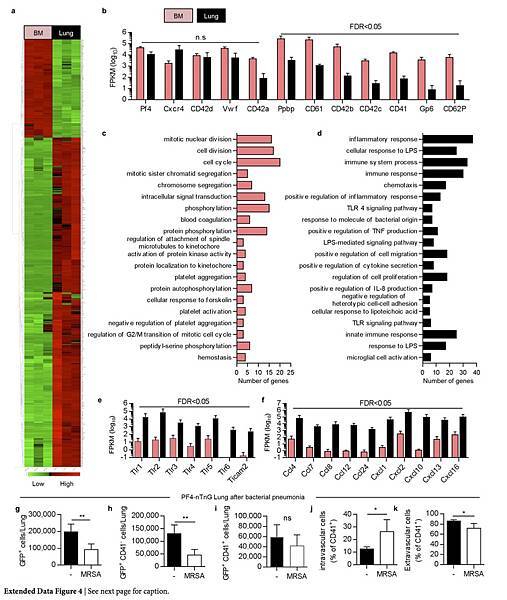
The majority of the nGFP+ cells in the lung were CD41− (Extended Data Fig. 3b), but both CD41+ and CD41− cells co-stained for GPVI and c-Mpl, confirming their megakaryocyte lineage (Extended Data Fig. 3c). The nGFP+ CD41− cells had a more immature profile with lower CD61 and CD42b expression, a smaller size and lower DNA content than the nGFP+ CD41+ cells (Extended Data Fig. 3e–i). Overall, lung megakaryocytes were more immature than bone marrow megakaryocytes (Extended Data Fig. 3j–m), but the total number of megakaryocytes in the lungs was comparable to that in the bone marrow (Fig. 2l, m). We also used RNA-sequencing (RNA-seq) to characterize lung and bone marrow megakaryocytes (nGFP+ CD41+ cells) in PF4-nTnG mice. We identified more than 700 genes that were expressed differentially in the lungs and bone marrow (Extended Data Fig. 4a and Supplementary Table 1); many megakaryocyte and platelet pathways were represented in both groups, but there was less expression of mature megakaryocyte markers in the lung group (Extended Data Fig. 4b, c), consistent with our profiling by immunostaining.
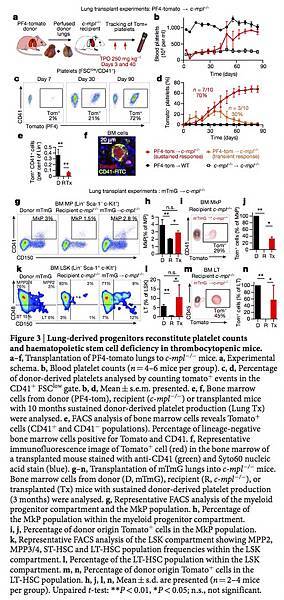
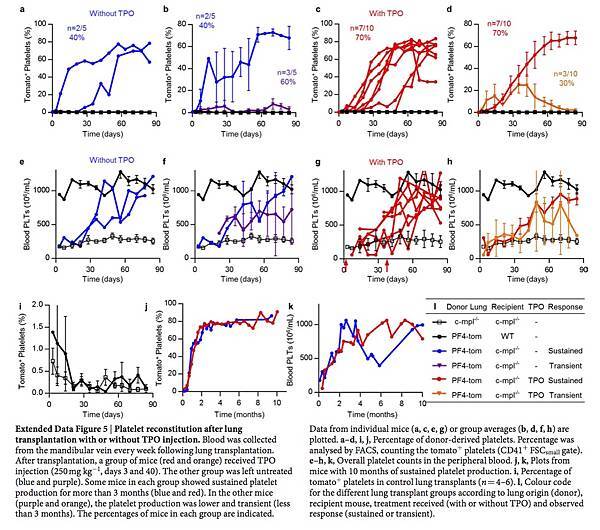
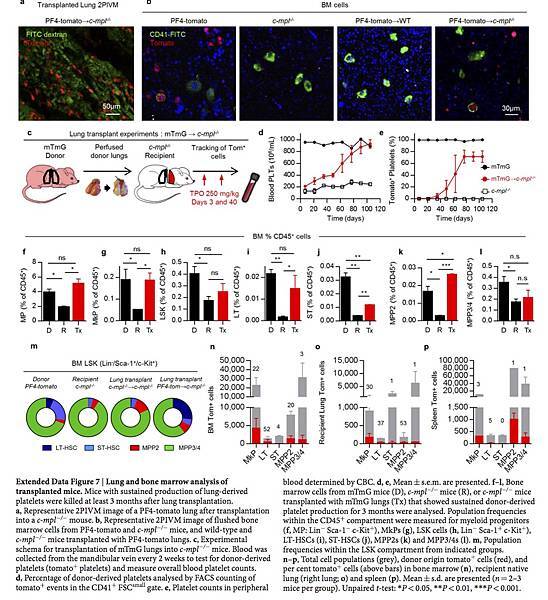
Lung 2PIVM indicated that only intravascular megakaryocytes released platelets. To test the function of extravascular megakaryocytes in the lungs, we used the orthotopic single-lung transplant model to adoptively transfer lung-resident cells. PF4-tomato donor lungs were extensively perfused and the left lungs were immediately transplanted into wild-type or c-mpl−/− thrombocytopenic recipient mice (Fig. 3a). These transplanted mice were injected with TPO at 3 and 40 days post-transplantation and bled weekly to track the number of platelets (Fig. 3a, b). Peripheral blood tomato+ events after lung transplantation are, by definition, of donor lung origin. In wild-type recipients, we detected low-level (1–2% of total CD41+ events) and transient production of tomato+ events (Fig. 3d and Extended Data Fig. 5i). However, in the majority (70%) of c-mpl−/− recipients, we detected large and sustained (90 days) production of tomato+ events (Fig. 3c, d and Extended Data Fig. 5c, d) that fully reconstituted platelet counts (Fig. 3b and Extended Data Fig. 5g, h). We observed the same response in two out of five c-mpl−/− recipients not treated with TPO after transplantation (Extended Data Fig. 5a, b, e, f). The tomato+ CD41+ events were also positive for CD42, GPVI and c-Mpl (Extended Data Fig. 6a, b) and expressed CD62P when stimulated with thrombin (Extended Data Fig. 6c–e), confirming that they were platelets.
Figure 3: Lung-derived progenitors reconstitute platelet counts and haematopoietic stem cell deficiency in thrombocytopenic mice.
a–f, Transplantation of PF4-tomato lungs to c-mpl−/− mice. a, Experimental schema. b, Blood platelet counts (n = 4–6 mice per group). c, d, Percentage of donor-derived platelets analysed by counting tomato+ events in the CD41+ FSClow gate. b, d, Mean ± s.e.m. presented. e, f, Bone marrow cells from donor (PF4-tom), recipient (c-mpl−/−) or transplanted mice with 10 months sustained donor-derived platelet production (Lung Tx) were analysed. e, FACS analysis of bone marrow cells reveals Tomato+ cells (CD41+ and CD41− populations). Percentage of lineage-negative bone marrow cells positive for Tomato and CD41. f, Representative immunofluorescence image of Tomato+ cell (red) in the bone marrow of a transplanted mouse stained with anti-CD41 (green) and Syto60 nucleic acid stain (blue). g–n, Transplantation of mTmG lungs into c-mpl−/− mice. Bone marrow cells from donor (D, mTmG), recipient (R, c-mpl−/−), or transplanted (Tx) mice with sustained donor-derived platelet production (3 months) were analysed. g, Representative FACS analysis of the myeloid progenitor compartment and the MkP population. h, Percentage of the MkP population within the myeloid progenitor compartment. i, j, Percentage of donor origin Tomato+ cells in the MkP population. k, Representative FACS analysis of the LSK compartment showing MPP2, MPP3/4, ST-HSC and LT-HSC population frequencies within the LSK compartment. l, Percentage of the LT-HSC population within the LSK compartment. m, n, Percentage of donor origin Tomato+ cells in the LT-HSC population. h, j, l, n, Mean ± s.d. are presented (n = 2–4 mice per group). Unpaired t-test: **P < 0.01, *P < 0.05; n.s., not significant.
In selected experiments, c-mpl−/− lung transplant recipients were followed for up to 10 months after transplantation. In these mice, we observed sustained production of tomato+ platelets and sustained reconstitution of platelet counts (Extended Data Fig. 5j, k).
Because platelet lifespan in mice is 3–5 days21, the persistence of donor-origin platelets for more than 3 months suggested that the transplanted lungs contained a progenitor population capable of long-term reconstitution of mature megakaryocytes and platelets. Indeed, the fact that the extravascular megakaryocytes were smaller than the intravascular megakaryocytes in the lungs and the extravascular megakaryocytes in the bone marrow and spleen could point to the presence of megakaryocyte progenitors.
We imaged lungs 3 months after transplantation and confirmed the persistence of PF4-tomato cells (Extended Data Fig. 7a). We also detected the presence of tomato+ CD41+ cells in the bone marrow of c-mpl−/− mice that had received PF4-tomato lung transplants using flow cytometry (Fig. 3e) and immunofluorescence (Fig. 3f and Extended Data Fig. 7b). To test for lung megakaryocyte progenitors and to track donor cells in recipient mice, we transplanted mTmG lungs, in which all cells and platelets are tomato+, into c-mpl−/− mice (Extended Data Fig. 7c–e). We next quantified the megakaryocyte progenitor (MkP) population in the bone marrow of c-mpl−/− mice transplanted with mTmG lungs by staining myeloid progenitors (Lin− Sca-1− c-Kit+) for CD41 and CD15022 (Fig. 3g). We found more myeloid progenitors and MkPs in the bone marrow of the lung transplant recipients than in c-mpl−/− bone marrow; the numbers in the transplant recipients were similar to the numbers of myeloid progenitors and MkPs normally found in the bone marrow of wild-type (mTmG) mice (Fig. 3h and Extended Data Fig. 7f, g). One-third of the MkPs in the bone marrow of c-mpl−/− mice transplanted with mTmG lungs expressed tomato (Fig. 3i, j).
We next tested whether the haematopoietic stem cell (HSC) deficiency characteristic of c-mpl−/− bone marrow9 could be reversed by lung transplantation. We gated on the bone marrow LSK (Lin− Sca-1+ c-Kit+) population and probed for the following subsets: long-term HSCs (LT-HSCs; CD48− CD150+), short-term HSCs (ST-HSCs; CD48− CD150−), multipotent progenitor 2 (MPP2) cells (CD48+ CD150+), and MPP3/4 cells (CD48+ CD150−)23 (Fig. 3k). Lung transplantation from TPO-competent (mTmG) donors reversed the LSK population deficiencies (Fig. 3l and Extended Data Fig. 7h–l). Lung–derived MkPs, LT-HSCs, ST-HSCs, MPP2s and MPP3/4s were also found in the bone marrow, spleen and recipient lungs (Fig. 3m, n and Extended Data Fig. 7n–p). A non-specific post-lung transplantation response was ruled out because transplantation of c-mpl−/− lungs into c-mpl−/− mice did not produce increased platelet counts (Fig. 3b) or alter the bone marrow composition (Extended Data Fig. 7m). Together, these results suggest that a haematopoietic progenitor population residing in the lungs can migrate to the bone marrow and reverse HSC defects and associated cytopenias.
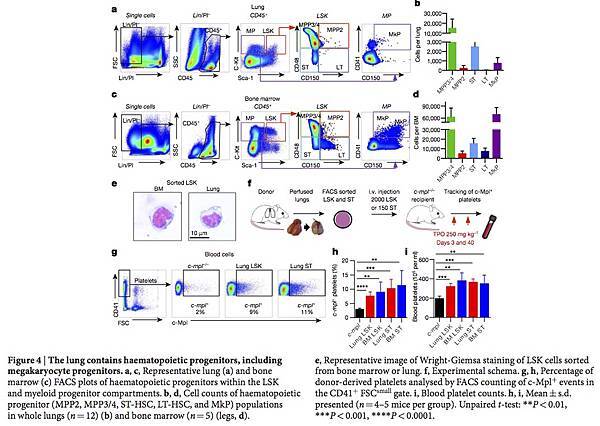
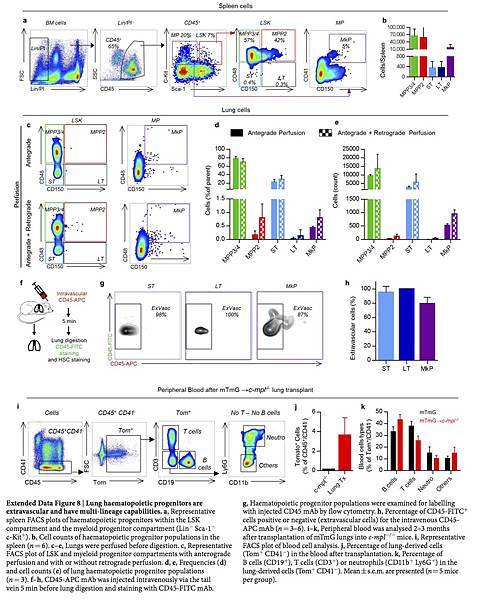
We tested for haematopoietic progenitors in dispersed wild-type lungs using similar gating on live CD45+ Lin− Sca-1+ c-Kit+ cells as in the bone marrow. We discovered that the lungs contain an array of haematopoietic progenitors, including ST-HSCs, MPP2s, MPP3/4s, myeloid progenitors and MkPs (Fig. 4a, b), which were morphologically indistinguishable from bone marrow LSK cells (Fig. 4e). These cells were present at lower numbers than in the bone marrow (Fig. 4c, d) and spleen (Extended Data Fig. 8a, b), except that there were more ST-HSCs in the lungs than in the spleen. These cells were extravascular, because they were not removed by perfusion and were not stained by intravascular CD45-APC antibodies (Extended Data Fig. 8c–h). To our knowledge, this is the first description of haematopoietic progenitor cells in the adult lungs, and we reasoned that these cells could be the source of the reconstituting effects of lung transplantation. To test this hypothesis, we isolated LSK and ST-HSCs from perfused wild-type lungs (and the bone marrow for comparison), injected these cells intravenously into c-mpl−/− recipients, and tested for the presence of c-Mpl+ platelets in the peripheral blood (Fig. 4f). Injection of lung LSK cells and ST-HSCs increased peripheral c-Mpl+ platelets and partially restored platelet counts, and injection of bone marrow cells had a similar effect (Fig. 4g–i). These results show that the adult lungs contain functional haematopoietic precursors capable of migration, bone marrow engraftment, and reconstitution of haematopoietic defects.
Figure 4: The lung contains haematopoietic progenitors, including megakaryocyte progenitors.
a, c, Representative lung (a) and bone marrow (c) FACS plots of haematopoietic progenitors within the LSK and myeloid progenitor compartments. b, d, Cell counts of haematopoietic progenitor (MPP2, MPP3/4, ST-HSC, LT-HSC, and MkP) populations in whole lungs (n = 12) (b) and bone marrow (n = 5) (legs, d). e, Representative image of Wright-Giemsa staining of LSK cells sorted from bone marrow or lung. f, Experimental schema. g, h, Percentage of donor-derived platelets analysed by FACS counting of c-Mpl+ events in the CD41+ FSCsmall gate. i, Blood platelet counts. h, i, Mean ± s.d. presented (n = 4–5 mice per group). Unpaired t-test: **P < 0.01, ***P < 0.001, ****P < 0.0001.
Finally, we tested whether lung haematopoietic progenitors are capable of multi-lineage bone marrow reconstitution. We transplanted lungs from mTmG donors to allow us to track mature lineages in the peripheral blood and bone marrow (Extended Data Fig. 7c), and detected sustained production of donor-derived (tomato+ CD41−) cells in the peripheral blood of the c-mpl−/− recipient mice (Extended Data Fig. 8i, j).
The donor-derived cells included platelets (Extended Data Fig. 7d, e), neutrophils, and B and T cells (Extended Data Fig. 8k). Considering that there are no neutrophil, B cell or T cell defects in c-mpl−/− mice and therefore no impetus for donor-derived reconstitution, these results demonstrate an important contribution of the lungs to overall haematopoiesis.
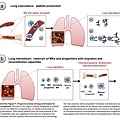
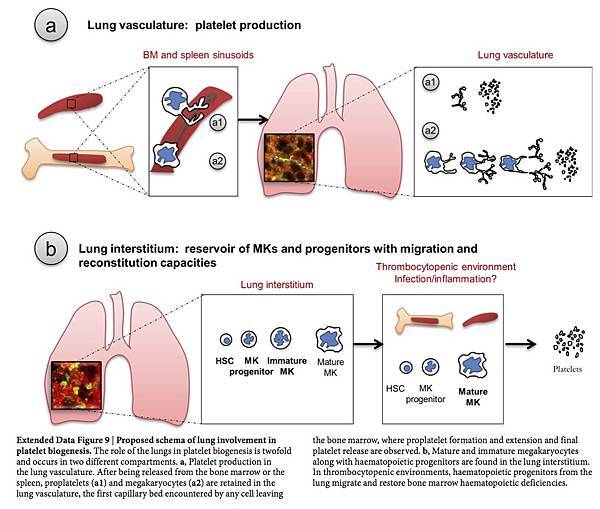
Our results provide direct evidence that the lungs are a major site of platelet biogenesis, which involves a distinct mechanism of proplatelet release from intravascular megakaryocytes (of extrapulmonary origin) in the lung microcirculation (Extended Data Fig. 9a). These results open new lines of investigation to improve our approach to treating thrombocytopenia, which affects millions of patients worldwide and causes substantial morbidity and mortality. We propose that the lungs are an ideal bioreactor for the production of mature platelets from megakaryocytes, and could advance studies of the treatment of thrombocytopenia with cell-based therapies16. Beyond the mechanical forces that promote proplatelet formation and extension, the lung may contain unique signalling partners for megakaryocytes that promote platelet release. Interactions between megakaryocytes and endothelial cells through glycoprotein 1b (GPIb)–vWF signalling have been shown to promote proplatelet formation in vitro24. Considering that vWF levels are particularly high in the pulmonary arteries25, this pathway could finely regulate megakaryocytes for platelet production.
The lungs are a reservoir for resident megakaryocytes and haematopoietic progenitor cells (Extended Data Fig. 9b), which raises questions about the factors responsible for the homing of these cells into and out of the lungs, the function of these cells in the lung niche, and the roles of these cells in host defence26.
Additionally, megakaryocytes are a rich source of cytokines and growth factors that have the potential to influence inflammatory or fibrotic lung diseases. Our RNA-seq analysis revealed that lung megakaryocytes were skewed towards an innate immunity function (Extended Data Fig. 4d–f and Supplementary Table 1), which may reflect the unique environment of the exposed lung versus the bone marrow.
Indeed, we detected changes in the resident and circulating lung megakaryocyte populations in mice with bacterial pneumonia (Extended Data Fig. 4g–k). Our findings may also be applicable to the field of lung transplantation, in which post-transplantation chimaerism could affect acute and chronic allograft rejection. Our results add to the growing evidence that the lungs are a sophisticated organ that is capable of regeneration after major injury, are a major site of platelet production, and have untapped potential as a contributor to haematopoiesis.
- Main• Methods• Accession codes• References• Acknowledgements• Author information• Extended data figures and tables• Supplementary information
Mice
Mice were housed and bred under specific pathogen-free conditions at the University of California, San Francisco (UCSF) Laboratory Animal Research Center and all experiments conformed to ethical principles and guidelines approved by the UCSF Institutional Animal Care and Use Committee. Male and female mice between 8 and 12 weeks of age were used for experiments. C57BL/6, PF4-Cre, Rosa26-LSL-tdTomato, mTmG, nTnG and Ptprca Pepcb BoyJ mice were purchased from Jackson Laboratories. To track platelets or megakaryocytes, PF4-Cre expressing mice were crossed with Rosa26-LSL-tdTomato, mTmG or nTnG reporter strains, in which the fluorophore of PF4-expressing cells (tdTomato or GFP) is localized to the cytoplasm, the cell membrane, or the nucleus, respectively. c-mpl−/− mice (C57BL/6 background) were obtained from a Material Transfer Agreement from Genentech.
Lung intravital imaging
We used 2PIVM to observe megakaryocyte and platelet production in real time in mouse lungs. A modified version27 of the previously published method of stabilized lung imaging was used8. Mice were anaesthetized with ketamine and xylazine and secured with tape to a custom heated microscope stage. A small tracheal cannula was inserted, sutured into place, and attached to a MiniVent mouse ventilator (Harvard Apparatus). Mice were ventilated with a tidal volume of 10 μl compressed air (21% O2) per gram of mouse weight, a respiratory rate of 130–140 breaths per minute, and a positive-end expiratory pressure of 2–3 cm H2O. Isoflurane was delivered continuously to maintain anaesthesia and mice were injected with 300 μl of 0.9% saline solution intraperitoneally every hour. The mice were placed in the right lateral decubitus position and a small surgical incision was made to expose the rib cage. A second incision was then made into the intercostal space between ribs 4 and 5, through the parietal pleura, to expose the surface of the left lung lobe. A flanged thoracic window with an 8-mm coverslip was then inserted between the two ribs and secured to the stage using a set of two optical posts and a 90° angle post clamp (Thor Labs)27, 28. We applied 20–25 mm Hg of suction (Amvex Corporation) to gently immobilize the lung. The two-photon microscope objective was then lowered into place over the thoracic window. In selected experiments, to permit identification of the lung vasculature, FITC dextran (50 μl of 25 mg/ml; Life Technologies) was injected intravenously into the tail vein before imaging.
Spleen and liver intravital imaging
Mice were anaesthetized and ventilated as noted above. To expose the spleen, a skin incision was made in the left flank. An incision was made along the costal margin to expose and externalize the liver. The same window as was used for lung imaging was used to facilitate imaging of the spleen and liver. The mouse was placed on a 37 °C temperature-controlled heated stage for the duration of the imaging and saline solution was administered intraperitoneally every hour.
Bone marrow intravital imaging
Mice were anaesthetized with an initial dose of ketamine and xylazine and anaesthesia was maintained with isoflurane delivered through a nose cone. Hair and the underlying subcutaneous tissue were removed to expose the calvarium. The periosteum was removed using a microsurgical knife. To stabilize the skull, we 3D printed an apparatus that was fixed to the mouse skull with Vetbond and attached to the heated stage below. The microscope objective was then lowered into a 5-mm bevelled hole filled with saline.
Two-photon microscopy
Intravital imaging was performed using a Nikon A1R Multi-photon microscope equipped with a Mai Tai DeepSee IR Laser (Spectra Physics) (UCSF BIDC). The MaiTai laser was tuned to 920 nm for simultaneous excitation of GFP or FITC and tdTomato. Emitted light was detected using a 25× water lens (Nikon) with green (500–550 nm) and red (570–620 nm) filters. Images were captured with a high-resolution galvano scanner (1 frame per second, 512 × 512 pixels). The microscope was controlled using NIS Element AR software (4.50). We captured a 1,052 μm × 1,578 μm x–y surface area (1.66 mm2) and z-stack images were acquired with z-depths of 5 μm (total of 40 μm z-depth). We captured a complete image every 1 min for 120 min.
Image analysis
Images were analysed using Imaris 7.6.1 (Bitplane) or NIS-Element (Nikon) software (UCSF BIDC). Surface analysis was performed to quantify and characterize the volume, diameter, or circularity of resident and circulating megakaryocytes or platelets. Megakaryocytes or megakaryocyte fragments were defined as PF4+ events with a diameter >15 μm. Platelets were defined as PF4+ events with a diameter between 0.5 and 5 μm. To calculate the number of platelets released by each megakaryocyte observed, the ratio of the megakaryocyte to platelet volumes was calculated for each of the 35 fragmenting megakaryocytes or proplatelets observed during lung imaging. Megakaryocytes were divided into three groups according to the number of platelets that can be produced by one megakaryocyte: small (<500 platelets, n = 18), medium (500–1,000 platelets, n = 7) and large (>1,000 platelets, n = 10).
Quantifying platelet production in the lung (see variables in Extended Data Table 1)
For each movie (~2 h), the megakaryocytes observed to be undergoing fragmentation in the lung (LungMKfrag) were quantified: LungMKfrag per hour = (LungMKfrag)/(Acquisition time in min) × 60. The number of platelets released by each megakaryocyte undergoing fragmentation in the lung was calculated using the volume ratio of the megakaryocyte volume to the average platelet volume: NPlat/MK = VolumeMK/VolumePlat. The number of platelets produced in the lung was then calculated: LungPlatelets per hour = LungMKfrag per hour × NPlat/MK × Lung fraction, where the lung fraction is the ratio of the mouse total lung volume29 to the observed lung volume: Lung fraction = Volumelung/Volumeobserved. Finally, we estimated the contribution of the lung to overall thrombopoiesis: % lung platelet production = (Lung platelets per hour × 24)/(Total Platelets per day) × 100.
The total number of platelets produced per day was calculated according to the number of circulating platelets in the mouse blood divided by the life span of platelets, and takes into account the fact that one-third of the produced platelets are sequestered by the spleen: total platelets per day = (PlatBlood(1 + PlatSpleen))/(LifePlat). In selected experiments, mice were treated with recombinant human thrombopoietin (rhTPO, Genentech) intraperitoneally (250 mg/kg), 5 days before lung imaging.
Lung, bone marrow, spleen and blood single-cell preparation for flow cytometry or cell sorting
Lung digestion. For lung HSC or megakaryocyte cell sorting, lungs were perfused before removal and digestion. Lungs were placed in 2 ml PBS with 5 μl/ml DnaseI (Roche) and 0.5 mg/ml LiberaseTM (Roche), minced with scissors in 15-ml tubes, and digested for 30 min at 37 °C before filtration through a 100-μm cell strainer and red blood cell lysis. Samples were then filtered through a 40-μm filter and resuspended for subsequent FACS staining. For experiments in which vascular localization was tested, mice were injected intravenously with CD41–APC (eBioscience) or CD45-APC (eBioscience) 5 min before lung collection.
Bone marrow isolation. Tibias and femurs from both legs were removed from mice following euthanasia. Bone marrow cells were flushed with PBS with 5 mM EDTA before filtration through a 70-μm cell strainer and red blood cell lysis.
Spleen isolation. The spleen was removed and pressed with the end of a plunger from a 1-ml syringe into 1-ml PBS with 5mM EDTA before filtration through a 70-μm cell strainer and red blood cell lysis.
Flow cytometry and cell sorting
For surface staining, cells or platelets were incubated with anti-Fc receptor antibodies (clone 2.4G2) and stained with antibodies in Hanks buffered salt solution (HBSS) with 2% fetal calf serum and 5 mM EDTA for 30 min.
Antibody clones used: CD41-APC (MWReg30, eBioscience), CD41-FITC (MWReg30, BD), CD41-BV421 (MWReg30, BioLegend), CD41-BV570 (MWReg30, BioLegend), c-mpl-Biotin (AMM2, IBL), streptavidin PE-Cy7 (BD), GPVI-FITC (JAQ1, emfret), F4/80-PB (CI:A3-1, BioLegend), CD45-APC (30F11, BioLegend), CD42d-APC (1C2, eBioscience), CD62P-APC (Psel.KO2.3, eBioscience). HSCs were stained with rat unconjugated Lin antibodies Gr-1 (RB6-8C5), Mac1 (M1/70), B220 (RA3-6B2), CD5 (53-7.3), CD4 (GK1.5), CD8 (53-6.7) (eBioscience), Ter-119 (BD), CD3 (17A2, BioLegend), goat anti-rat-PE-Cy5 (Invitrogen), c-Kit-APC-eFluor780 (2B8, eBioscience), Sca-1-PB (D7, BioLegend), CD48-APC (HM48-1, BioLegend), CD150-PE-Cy7 (TC15-12F12.2, BioLegend) and CD45.2-FITC (104, eBioscience). HSC and progenitor populations were defined as follows: myeloid progenitor (Lin− CD45+ Sca-1− c-Kit+), megakaryocyte progenitor (CD150+ CD41+), LSK compartment (Lin− CD45+ Sca-1+ c-Kit+), MPP2 (LSK CD48+ CD150+), MPP3/4 (LSK CD48+ CD150−), ST-HSC (LSK CD48− CD150−) and LT-HSC (LSK CD48− CD150+). Mature blood cells were stained with CD19-PB (6D5, BioLegend), Gr-1 APC-Cy7 (RB6-8C5, eBioscience), CD3-PerCP710 (17A2, eBioscience), and CD11b-APC (M1/70, BD). For sorting HSCs, a c-kit+ cell enrichment step was done before staining the cells using c-kit antibody-conjugated magnetic beads and MACS separation columns (Miltenyi Biotec). Stained cells were re-suspended for final analysis in Hanks buffered salt solution (HBSS) with 2% serum (FCS) and 1 μg/ml propidium iodide for dead cell exclusion. Samples were analysed on a LSRII flow cytometer (BD Biosciences) and cell sorting was performed using a BD FACS Aria II (BD Biosciences) in the UCSF Flow Cytometry Core. Analysis of flow cytometry data was performed using Flowjo (Treestar)
Lung perfusion
Lungs were perfused before lung transplant experiments, FACS, or cell analysis. Mice were anaesthetized with an intraperitoneal injection of ketamine (50 mg/kg) and xylazine (10 mg/kg). A 20-gauge angiocath was inserted into the trachea and connected to a ventilator. Through a midline abdominal incision the diaphragm was incised circumferentially and 0.1 ml heparin was injected directly into the inferior vena cava. A thoracotomy was performed to expose the heart and lungs. Cold PBS (5 ml) with 0.1 ml heparin solution was perfused directly into the right ventricle using a 27-gauge needle. The trachea was then tied and the heart–lung block removed and placed in a small tube containing PBS. In selected experiments, we also performed retrograde lung perfusion by instilling 5 ml cold PBS with 0.1 ml heparin solution into the left atrium.
Lung transplant experiments
Left lung transplants in mice were performed as previously described18. Lungs from PF4-tomato or mTmG donor mice were perfused and the left lung was immediately transplanted into C57BL/6 wild-type or c-mpl−/− recipients. Selected c-mpl−/− recipients received recombinant human thrombopoietin (rhTPO, Genentech) intraperitoneally (250 mg/kg) on days 3 and 40 after transplantation. Blood was collected from the submandibular vein every week to count blood platelets, donor-derived platelets (tomato+ platelets) and donor-derived mature blood cells. The transplanted mice were analysed for 3 months and then euthanized for bone marrow, blood, and lung removal and analysis. In selected experiments, mice were allowed to survive for 10 months after transplantation before analysis. For 2PIVM after lung transplantation, a perfused mTmG lung was transplanted into a PF4-mTmG recipient or vice versa. The transplanted lung was imaged immediately after transplantation.
Blood collection and platelet counting
For whole blood analysis, blood was withdrawn from the submandibular vein for survival bleeding or by cardiac puncture in terminal experiments. Blood was collected into either acid citrate dextrose (Sigma-Aldrich) for flow cytometry analysis or EDTA tubes (BD microtainer) for platelet counting. Platelet counts in the peripheral blood were measured with a Hemavet 950 FS complete blood counting instrument (Drew Scientific) and confirmed using manual platelet counts.
Cell immunofluorescence
Lung megakaryocytes. Nucleated cells that were double-positive for tomato and CD41 were sorted from digested lung tissue and cytospin slides were prepared. The cells were fixed with PFA 4% and permeabilized with 0.5% Triton. After saturation with PBS/BSA 3%, cells were stained overnight at 4 °C with sheep anti-vWF antibody (Abcam) and 1 h with anti-Sheep AlexaFluor488 antibody (Invitrogen). Slides were mounted with DAPI mounting medium (Molecular Probes) and analysed on a Nikon TI-E high-throughput epifluorescence microscope (UCSF Nikon Center).
Bone marrow cells after lung transplants. Bone marrow cells were isolated (see single-cell preparation methods) and resuspended in 1 ml PBS-EDTA 5 mM. Two-hundred and fifty microlitres of the suspension was stained for 20 min at room temperature in the dark with 1 μm Syto60 (cell-permeant nucleic acid stain) and anti CD41-FITC (1 μl). Cells were washed, resuspended in PBS, and seeded in a 6-well plate for immediate imaging on a Nikon A1R Multi-photon microscope (UCSF BIDC). Cells were excited with a 920-nm laser for simultaneous excitation of FITC (green), tdTomato (red) and Syto60 nucleic acid stain (FarRed).
Platelet activation assay
To determine whether the tomato+ CD41+ events detected in the peripheral blood after lung transplantation were bona fide platelets, we stimulated whole blood with thrombin (10 nM) to induce the expression of P-selectin (RB40.34, BD)30, which was measured by flow cytometric analysis and compared to platelets from PF4-tomato mice.
MRSA infection
We used the SF8300 strain of MRSA (methicillin-resistant Staphylococcus aureus, obtained from C. Chambers at UCSF), which is a minimally passaged USA300 clinical strain representative of the epidemic clone USA300-0114. Stock solutions of SF8300 at the mid-logarithmic growth phase (1010 CFU/ml) were aliquoted and frozen at −80 °C using standard techniques. On the day of the experiment, a vial of SF8300 was thawed and diluted with PBS to the concentration needed (5 × 10⁷ CFU per mouse in 50 μl) for direct tracheal instillation into anaesthetized PF4-nTnG mice. Lungs were harvested 24 h after inoculation for single-cell preparation and flow cytometry. To test for vascular localization, mice were injected intravenously with CD41–APC (eBioscience) 5 min before lung collection and CD41-FITC staining.
RNA-seq analysis
For RNA-seq experiments, we used PF4-nTnG mice and sorted PF4+ CD41+ cells from lung and bone marrow prepared for single-cell suspension and flow cytometry analysis. For each experiment, tissue from four mice was pooled and cells were sorted directly into lysis buffer. Total mRNA was isolated from between 1 × 10⁴ and 4 × 10⁵ purified cells using a Dynabeads mRNA DIRECT kit (Ambion-Life Technologies). Three independent replicates were used for each population. An mRNA library was prepared by the UCSF SABRE Functional Genomics Facility using low input Nugen Ovation plus Nextera kit (<100 ng RNA) and sequencing was performed using a single-end 50-bp RNA-seq Illumina TruSeq Stranded PolyA library kit and an Illumina HiSeq 4000 machine. Sequencing yielded ~432 million reads in total with an average read depth of 72 million reads per sample. Reads were then aligned to the mouse genome (aligner: STAR_2.4.2a aligner, alignment genome: Ensembl Mouse GRCm38.78) and genes that mapped uniquely to known mRNAs were used to assess differential expression between lung and bone marrow groups. Differential expression testing was carried out using DESeq2 v1.14.0.
Using a log ratio test and fold-change cutoffs (false discovery rate (FDR) <0.05), we found 705 genes that were differentially expressed: 543 were upregulated in lung megakaryocytes and 162 in bone marrow megakaryocytes. Functional pathways representative of each gene signature were analysed for enrichment in gene categories from the Gene Ontology Biological Processes (GO-BP) database (Gene Ontology Consortium) using DAVID Bioinformatics Resources. For gene signatures and each GO category, the significance of the number of overlapping genes in the two sets was calculated using a Fisher’s exact test performed by the DAVID software. The P value resulting from this test reflects the probability of obtaining the observed overlap or greater by chance. GO-BP categories with at least three genes and P < 0.001 were identified.
Statistical analysis
For surface analysis, minimum-to-maximum boxplots are shown: the line in the middle of the box is plotted at the median, the box extends from the 25th to the 75th percentile and the whiskers go down to the smallest value and up to the largest. The + indicates the mean. Other results plotted as histograms are reported as mean ± s.d. and were analysed by t-test, and multi-group comparisons were performed using a one-way ANOVA test and Bonferroni post-hoc test (GraphPad PRISM version 5.0; GraphPad Software Inc.). In all cases where statistical significance is provided, variance was not statistically different between groups. Sample sizes were chosen on the basis of previous experience in the laboratory with respect to inherent variability in intravital imaging, lung transplantation, and cellular transplantation experiments. There is a 10% surgical failure rate with the mouse orthotopic lung transplantation surgery, and it was pre-established that these mice would be excluded from the analysis. Animals within each cohort were randomly assigned to treatment groups. Blinded analysis was not performed in these studies. P values
cally significant, indicated by asterisks in figures, unless otherwise noted.
Data availability
The RNA-seq data that support the findings of this study have been deposited in the NIH SRA database with the accession code SRP097794.






 留言列表
留言列表
 線上藥物查詢